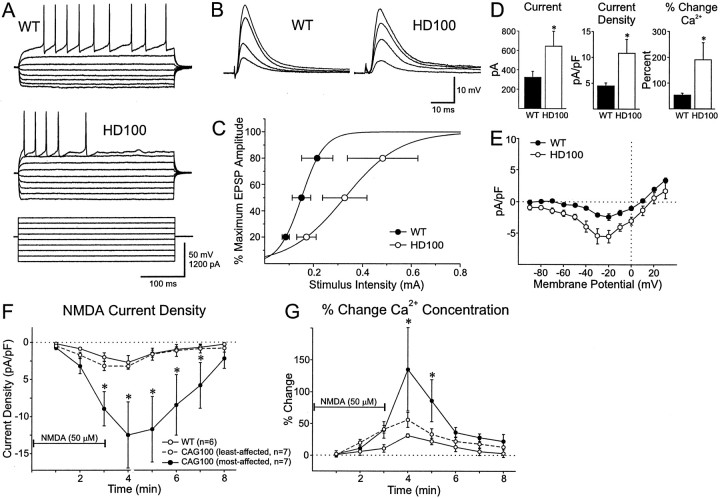
Fig. 7.
Electrophysiological characteristics of striatal neurons in HD transgenic mice. A, Responses to intracellular square wave hyperpolarizing and depolarizing current pulses in WT and HD100 striatal neurons. Amplitudes and durations of pulses are shown in the bottom traces (for clarity, the voltage responses induced by the highest intensity pulses are not shown for WT). B, EPSPs evoked by increasing intensities of stimulation of WT and HD100 striatal neurons. C, Input–output relationships for synaptic responses evoked in WT and HD100 striatal neurons. Each point represents the mean intensity (± SE) to evoke synaptic responses that were 20, 50, and 80% of the maximum amplitude. D, Responses to NMDA. Peak currents (left), current densities (middle), and the percentage of changes in intracellular Ca2+ (right) in WT (n = 6 neurons, 3 WT mice) and HD100 mice (n = 14 neurons, 4 HD mice) after stimulation of striatal neurons with 50 μm NMDA. Values are means and ± SE. Asterisk denotes p< 0.05 for peak current and current density and p< 0.025 for Ca2+, using Welch's approximation to the t test (Welch, 1947). E, Current density–voltage relationships in response to a ramp voltage command before and after the bath application of 50 μm NMDA in HD100 (n = 5) and WT (n = 5) striatal neurons. Current density–voltage relationships were calculated as the response to the agonist minus a baseline response in the absence of the agonist. NMDA current densities were significantly larger in transgenic than in control animals from −50 to +10 mV (p < 0.05). F, Time course of changes in mean NMDA-induced current densities (± SE). HD100 group was divided into least- and most-affected neurons (see Results for details and justifications). Asterisks inF and G indicate that the most-affected HD100 group was significantly different from its respective WT and least-affected HD100 group (p < 0.05). Thehorizontal line indicates the application of NMDA inF and G. G, Time course of mean percentage of changes (± SE) in Ca2+concentration in most- and least-affected HD100 and WT neurons.

