
Fig. 2.
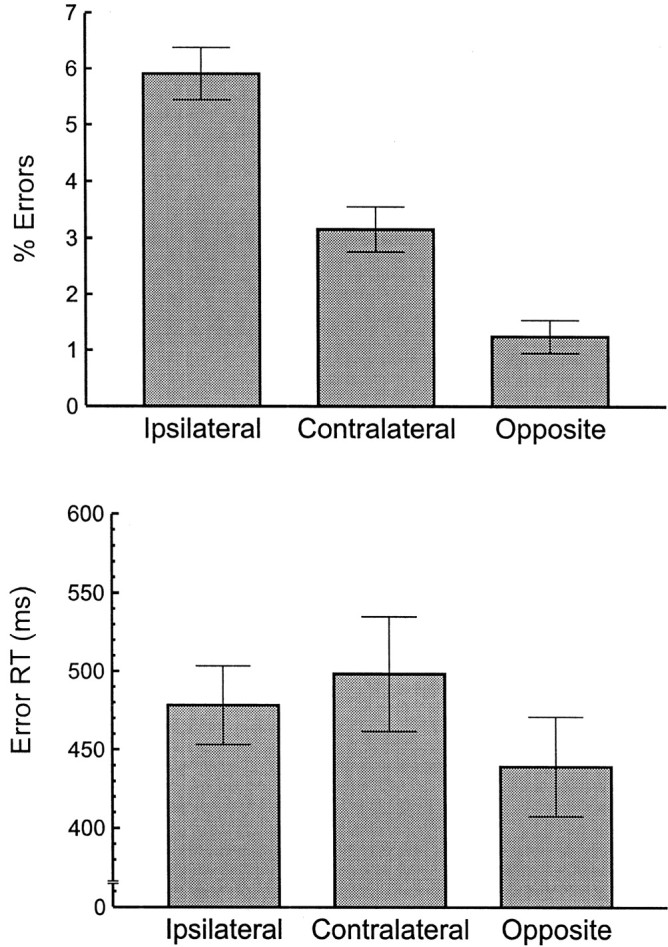
A subgroup of six participants showing the greatest tendency to make ipsilateral errors. Percentage of errors (top) and mean RT (bottom) are shown as a function of error type for participants showing more ipsilateral errors than contralateral errors (ipsilateral-prevalent participants). Error types are described in Figure 1. Error bars are ±1 SE.