
Fig. 3.
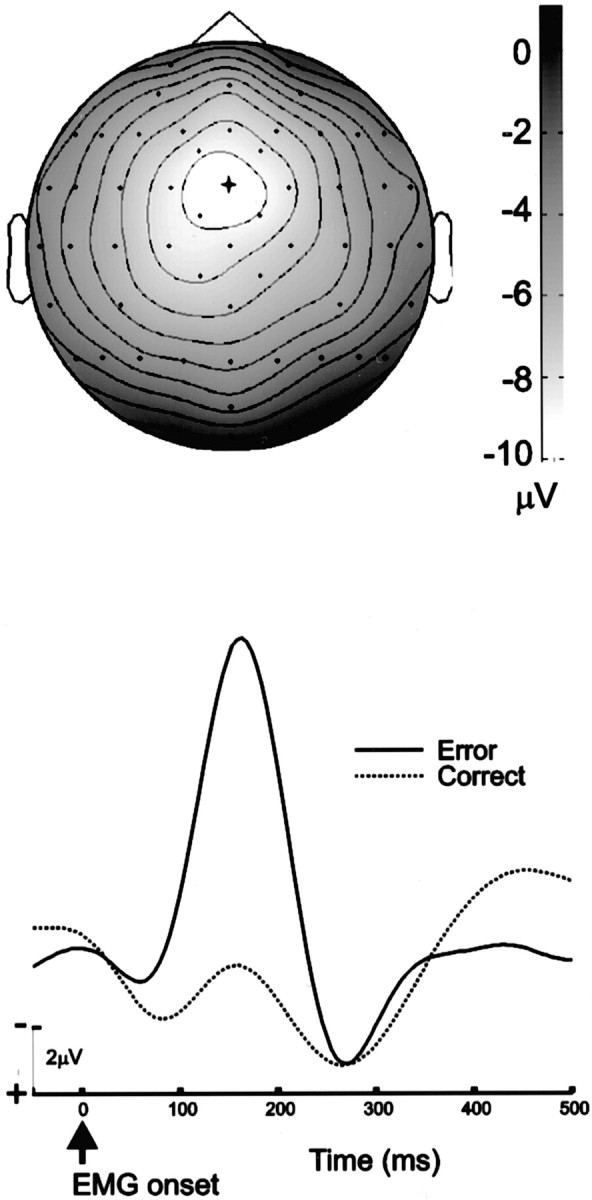
Grand average ERN scalp topography and waveform.Top, A topographic map of the ERN peak (error-correct difference) at 155–165 msec after the onset of EMG activity.Lighter colors represent regions of greater negativity;isocontour lines represent increments of 1 μV.Dots represent electrode locations. The view shows the top of the head, with the nose pointing upward. The scalp maximum of the ERN occurs at the FCz electrode, indicated by thecross. Bottom, the grand average ERN waveform at FCz. The ERN is evident as a negative-polarity peak at 165 msec after EMG onset.