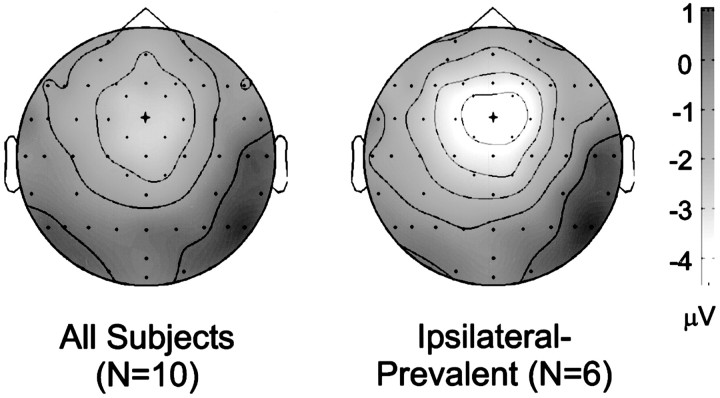
Fig. 6.
Topographic maps confirm that the event-related potential conflict effects resulted from changes in the cortical generator of the ERN. Maps represent the difference between the ipsilateral errors and opposite errors at 155–165 msec after the onset of EMG activity. Lighter colors represent regions of greater negativity; isocontour lines represent increments of 1 μV. Dots represent electrode locations. The view shows the top of the head, with the nose pointing upward. The scalp maximum of the conflict effect occurs at the FCz electrode, the site of the ERN, indicated by the cross.Left, Map from all 10 participants;right, map from the ipsilateral-prevalent group.

