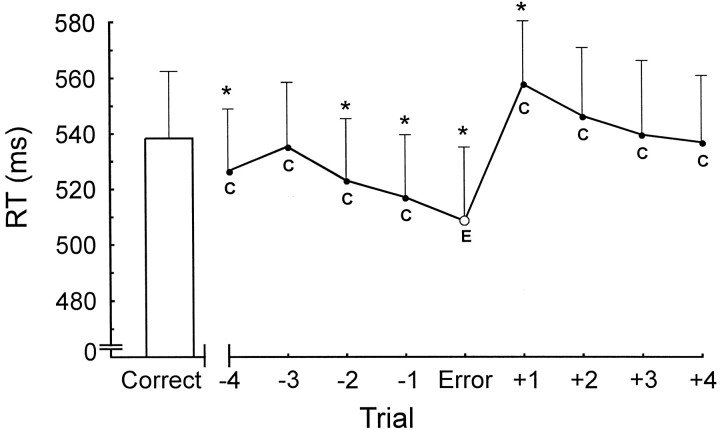
Fig. 7.
Reaction times on correct trials (C) before and after the error (E) show that participants increased their speed before the error and then slowed responses after the error. Error bar indicates mean correct reaction time for all trials except those that occur immediately after errors. The reaction times in theline represent four correct trials before the error (−4) to four correct trials after the error (+4). Error bars are +1 SE. Values differing from the mean correct reaction time on theleft are indicated by asterisks(t(9) = p < 0.05; one-tailed t test). From left toright, the t values are 2.25, 1.25, 3.12, 4.42, 3.02, −2.07, −0.65, 0.50, and 1.21.

