
Fig. 4.
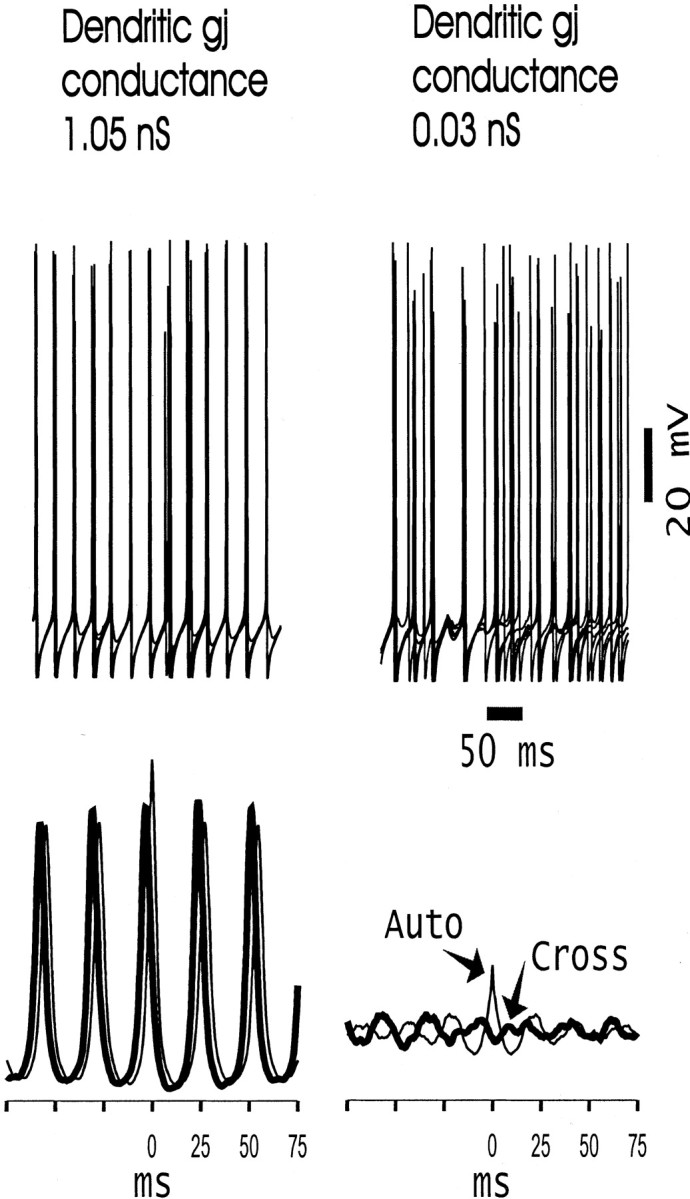
Alternative means of viewing synchronization in the interneuron network. The top traces show superimposed somatic voltages of five nearby basket cells, in the middle of the array, for cases in which the dendritic gap junctions are open (1.05 nS conductance; left) or nearly shut (0.03 nS conductance; right). Traces below are autocorrelations (thin lines; Auto) and cross-correlations (thick lines; Cross) of average somatic signals (28 nearby interneurons, 500 msec of data) taken from either end of the array. The horizontal axisof these traces is in milliseconds, and thevertical axes are the same in each case.gj, Gap junction.