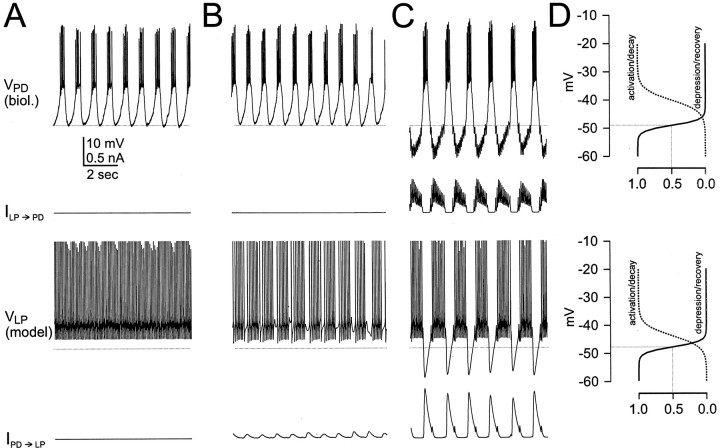
Fig. 3.
The two modes of oscillation. Network activity was examined at different values ofGPD→LP.GLP→PD was kept fixed at a value of 1.5 nS. Shown are the time courses of the membrane potential of the biological PD neuron, the synaptic current from the LP model to the PD neuron, the membrane potential of the LP model neuron, and the synaptic current from the PD neuron to the LP model neuron withGPD→LP = 0 (A),GPD→LP = 2 nS (B),GPD→LP = 4 nS (C). In A and B, the rhythm is determined by the dynamics of the PD neuron (CD mode). InC, the rhythm is controlled by the dynamics of the synapses (SC mode). The horizontal dotted linessuperimposed on the PD neuron and the LP model neuron voltage traces represent the midpoint of the steady-state depression/recovery curves of the PD to LP synapse and the LP to PD synapse, respectively.D, Steady-state activation and depression/recovery curves for the PD to LP synapse (top panel) and the LP to PD synapse (bottom panel). The voltage range (ordinate) is identical to the voltage range of the traces in A–C. The dotted drop lines represent the midpoint of the depression/recovery curves.

