Fig. 5.
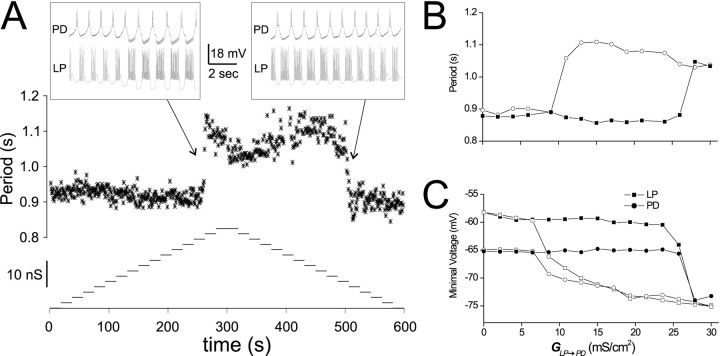
Oscillation mode can be switched by changing the maximal synaptic conductance. GPD→LP was held at a value of 1 mS/cm2. Every 20 sec,GLP→PD was incremented in steps of 2 mS/cm2 from 0 to 30 mS/cm2 and then stepped back to 0. A, Cycle periods (stars, top trace) are plotted as function of time. Bottom trace showsGLP→PD values as a function of time.Insets show the voltage traces of the biological PD neuron and LP model neuron at the transitions between the two modes.B, The cycle period at the end of each 20 sec stretch is plotted as a function of the correspondingGLP→PD. The filled squarescorrespond to the up steps, and the open circlescorrespond to the down steps. C, Trough voltage values of the PD neuron (circles) and the LP model neuron (squares) for the same cycles shown in B.Filled and open symbols represent the up and down steps, respectively.

