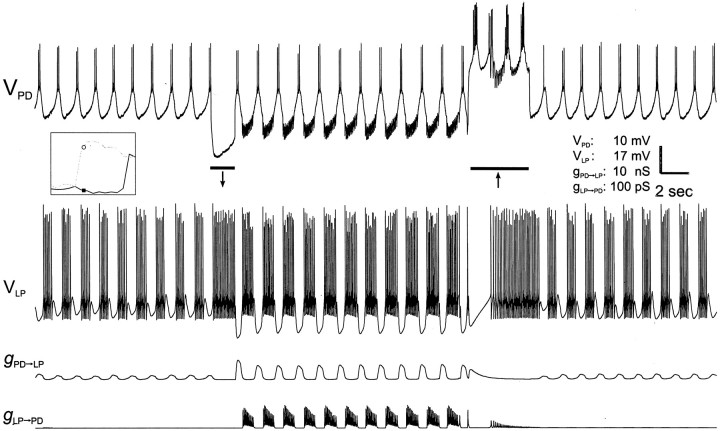
Fig. 8.
Current–pulse injection switches the network between oscillation modes. The network is the same as in Figure 5.GPD→LP andGLP→PD were set at 1 and 10 mS/cm2, respectively. With these values, the network operated in its bistability regimen (as indicated by thepoints on the inset). The top two traces are the membrane potentials of the biological PD neuron and the LP model neuron. The bottom two traces are the actual conductances of the PD to LP and LP to PD synapses. The network started in CD mode. At the time indicated by the left bar, a −2 nA, 1.7 sec current pulse was injected into the PD neuron, and the network switched to SC mode. At the time indicated by the right bar, a +2 nA, 4 sec current pulse into the PD neuron switched the network back to the CD mode.

