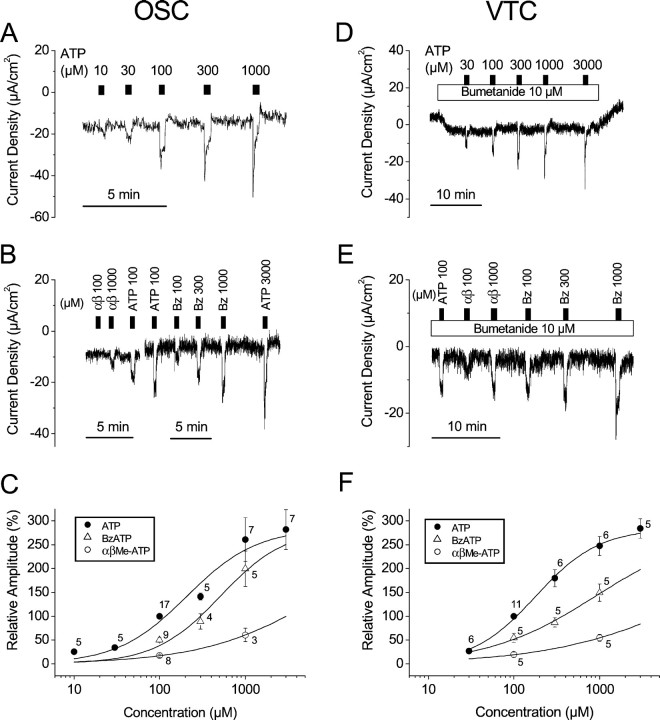
Fig. 4.
Dose–response relationships of ATP analogs in OSC and VTC. A, B, C, OSC; D, E, F, VTC. There is a discontinuity in B that indicates recordings from two different tissues. Numbersin C and F indicate numbers of observations at each concentration. In the dose–response curves (C, F), the data were normalized based on the response to 100 μm ATP. In the experiments on VTC, bumetanide (10 μm) was added to the bath solution to exclude influence from vestibular dark cells. αβ, αβmeATP; Bz, BzATP.

