
Fig. 1.
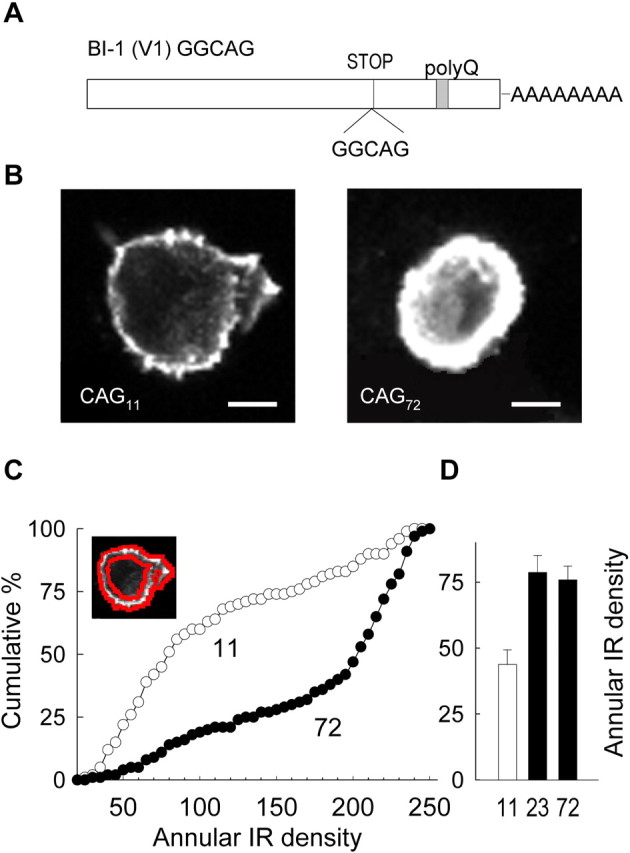
Expanded α1A gives rise to greater immunoreactivity than WT. A, Schematic representation of isoform BI-1 (V1) GGCAG, showing the position of the GGCAG insertion [near the stop codon (STOP)], which results in a frame shift and the inclusion of a polyQ tract in the human α1Acalcium channel. B, Representative examples of HEK293 cells expressing CAG11 and CAG72α1A. Note that CAG72 yields stronger immunoreactivity than CAG11 when expressed under parallel conditions. Scale bar, 5 μm. C, Annular immunoreactivity analysis reveals greater IR adjacent to the edge of the cell in EXP α1A. Cumulative distribution of annular IR density in cell populations expressing CAG72α1A (n = 186) compared with CAG11 α1A (n = 144) (p < 0.001). Inset, Exemplar cell showing annulus for IR analysis outlined in red.D, In a separate experiment comparing membrane IR values in cells expressing EXP constructs CAG23 and CAG72, mean values are similar (p > 0.1). CAG11 is shown for comparison (n = 28, 53, and 47 for CAG11, CAG23, and CAG72, respectively).