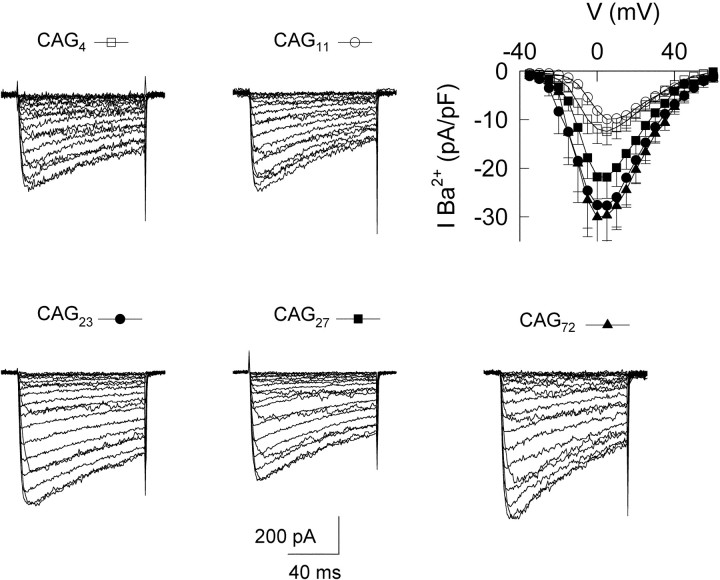
Fig. 4.
Electrophysiological analysis of the expression of the α1A calcium channel with normal and expanded number of CAG repeats. B, Ba2+ currents evoked by 100 msec depolarizing pulses from a holding potential (Vh) of −90 mV to test potentials (Vtest) of −40 to +50 mV with 5 mV steps. Top row, Currents originated from α1A channels with normal number of repeats (WT): CAG4 and CAG11. Bottom row, Currents from cells expressing mutant channel repeats (EXP): CAG23, CAG27, and CAG72. The current–voltage relationship (I–V curve) for all five samples is shown in the top row. The symbols used for each construct throughout this study are depicted above each currenttrace.

