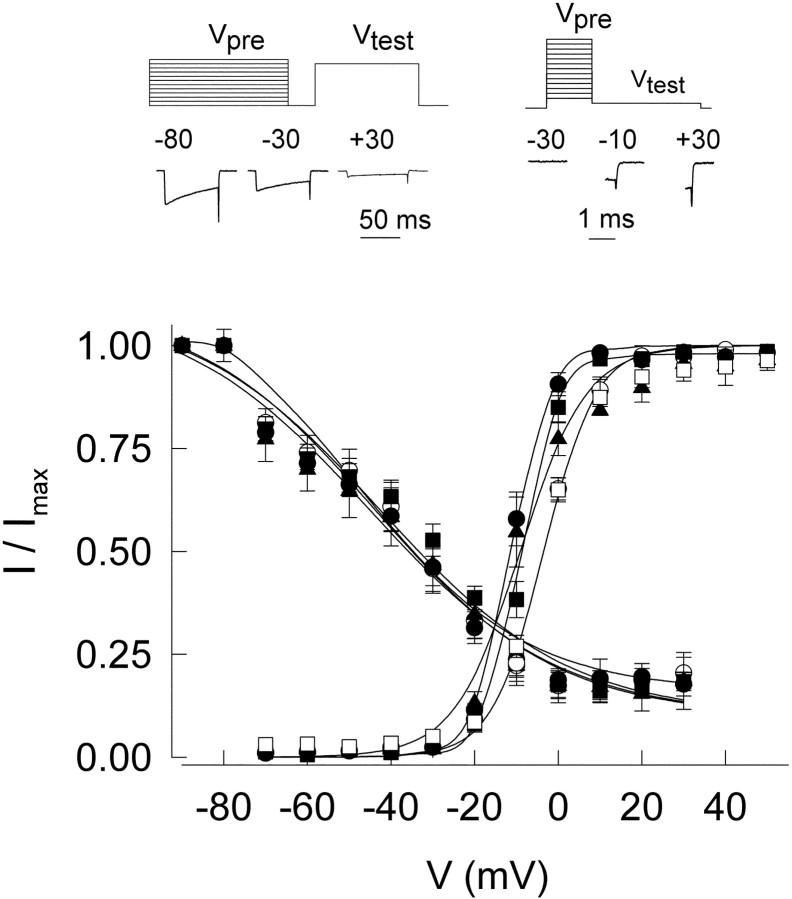
Fig. 6.
Voltage dependence of inactivation and activation. Inactivation curves (descending curves) show no difference between normal and mutant clones, whereas the activation parameters (ascending curves) of the expanded constructs CAG23, CAG27, and CAG72 show a slight shift to hyperpolarized potentials compared with controls, CAG4 and CAG11. Three representative traces of inactivation (left) and activation (right) experiments are shown at thetop. Prepulse voltages (Vpre) are indicated in each case, and voltage protocols are represented above (Vtest).

