
Fig. 2.
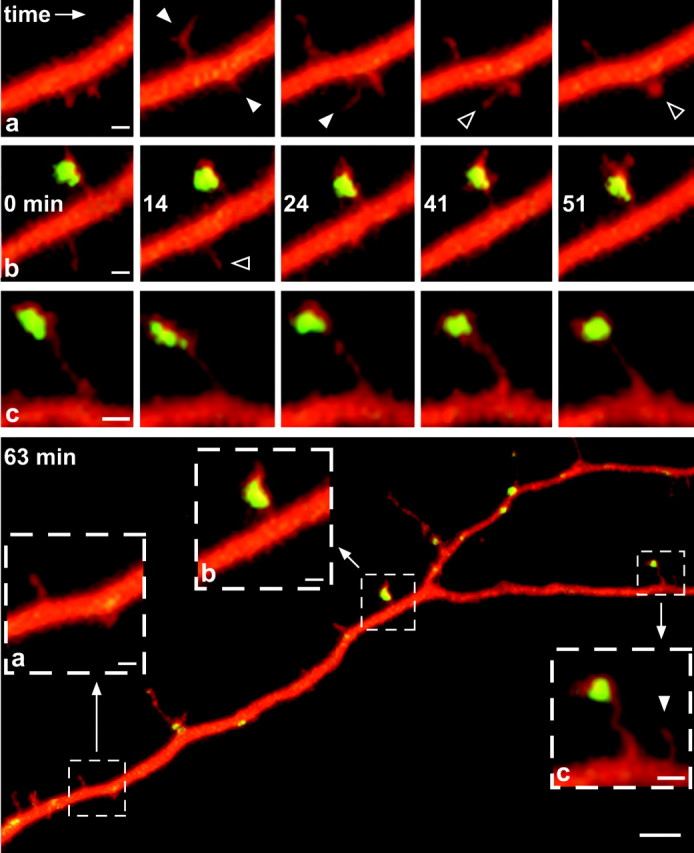
Confocal time-lapse analysis of filopodia–spine stability and PSD-95 clustering. Time-lapse series of a neuron (10 din vitro) that expressed WT PSD-95/GFP (green) and was filled with sulforhodamine (red). Spots of PSD-95/GFP clustering appearyellow. The bottom panel shows an overview of the dendrite. Scale bar, 5 μm. Three areas are magnified (see dashed outlines labeled a–c). Time series in the top rows advances incolumns from left to rightfor the three areas of interest; the second row shows time stamps in minutes. For simplicity, not every time point is shown. Newly forming (white arrowheads) and disappearing (black arrowheads) filopodia–spines are marked. Note that PSD-95/GFP-containing structures are stable over time (i.e., they do not turnover) but can exhibit structural changes. Scale bars: magnified areas, 1 μm; bottom panel overview, 5 μm.