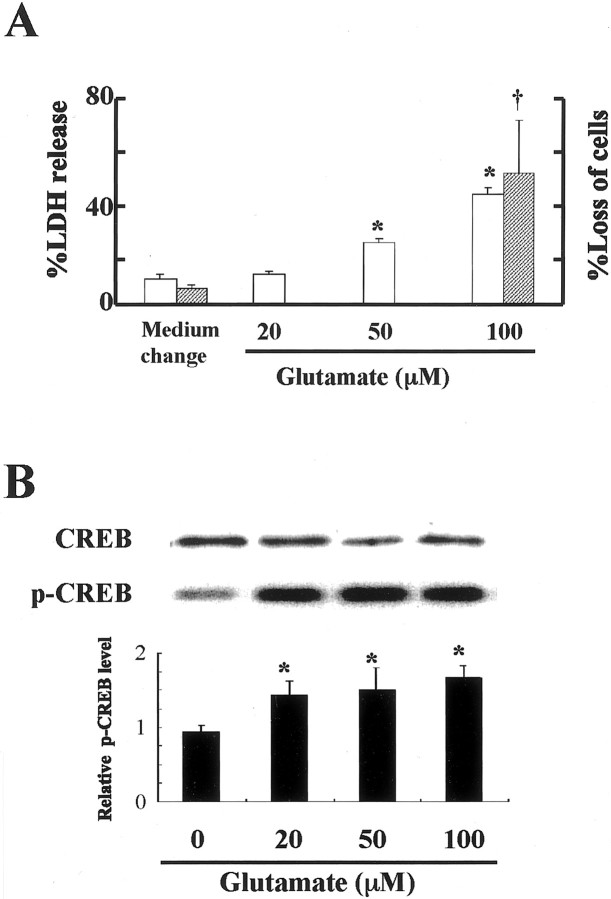
Fig. 6.
Glutamate-induced CREB phosphorylation after sublethal stress. A, Evaluation of neuronal death by the measurement of LDH released into culture media or by the counting of damaged cells. Open columns indicate the percentage of cell death (LDH release) 24 hr after treatment with the indicated concentrations of glutamate, and shaded columns indicate the percentage of loss of cells (cell counting) 24 hr after exposure to 100 μm glutamate. B, Effects of different concentrations of glutamate (20, 50, and 100 μm) on CREB phosphorylation 10 min after an addition of glutamate, as determined by Western blot analysis. Although the total CREB level in each lane was similar, CREB phosphorylation was enhanced by 20, 50, and 100 μm glutamate. Fold increase in CREB phosphorylation is quantified in a bar graph. Each column and bar represents mean ± SD (n = 6 for each glutamate concentration); *,†p < 0.05 versus controls.

