Fig. 3.

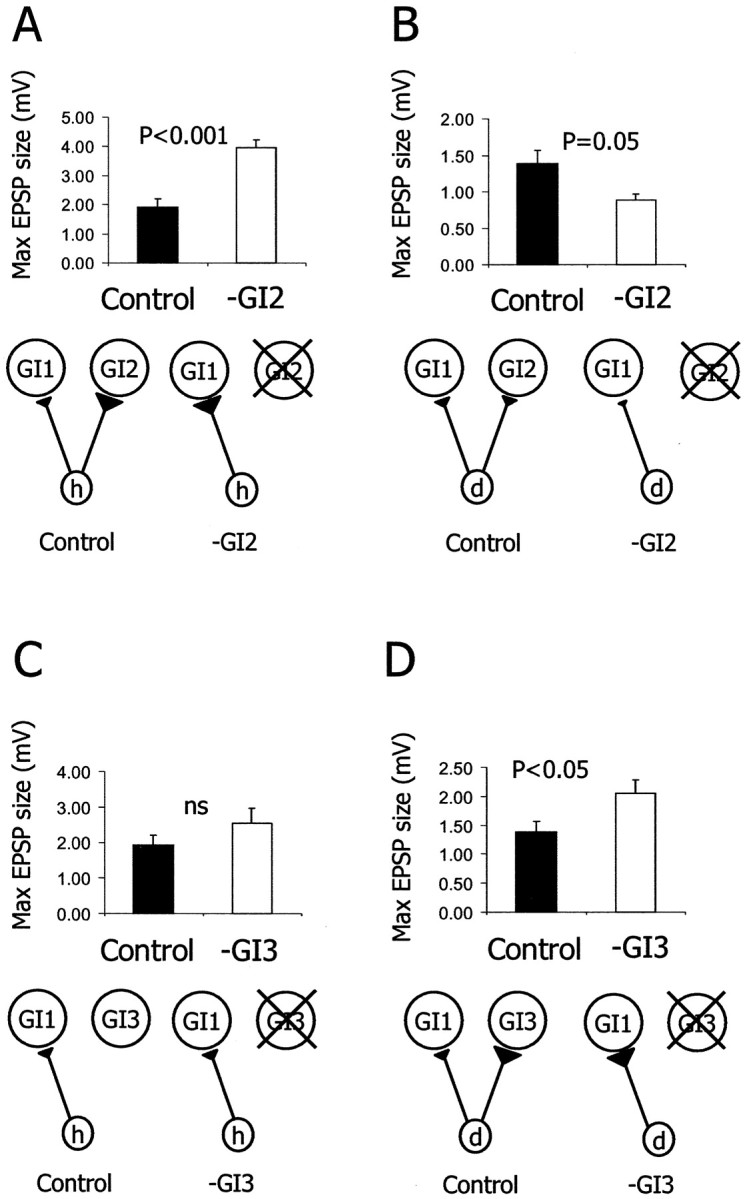
Synaptic reorganization after single cell ablation. A, B, Histograms of the average EPSP amplitude evoked in GI1 in control animals (n = 5) and in GI2-ablated animals (n = 5). A, After GI2ablation, the h to GI1 EPSP amplitude increased by 105% (t test; p < 0.001).B, After GI2 ablation, the d to GI1 EPSP amplitude decreased by 35% (ttest; p = 0.05). C,D, Histograms of the average EPSP amplitude evoked in GI1 in control animals (n = 5) and in GI3-ablated animals (n = 5).C, After GI3 ablation, the h to GI1 EPSP amplitude did not change significantly (t test; p > 0.05).D, After GI3 ablation, the d to GI1 EPSP amplitude increased by 48% (ttest; p < 0.05). A schematic drawing of the relevant elements of the synaptic circuitry in the control and the experimental condition is presented below each histogram.
