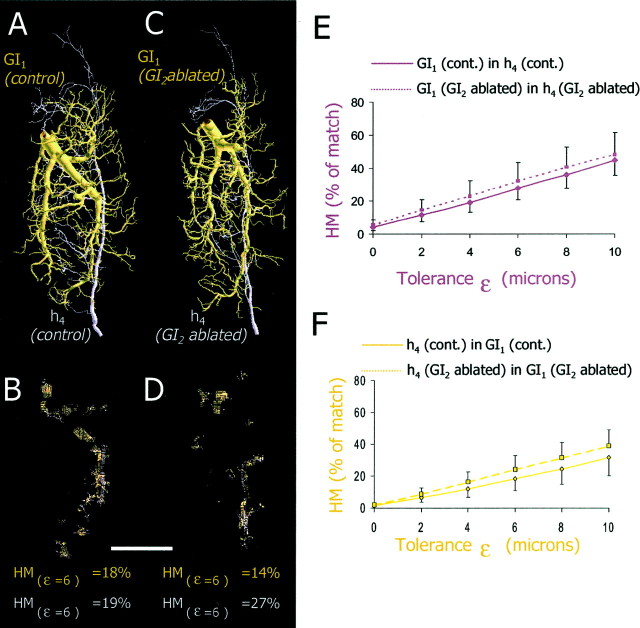
Fig. 8.
Spatial analysis of the overlap between presynaptic axonal trees of h4 and postsynaptic dendritic trees of GI1. A, A dendritic tree of GI1 (brown) and an axonal tree of h4 (purple) from control animals are shown aligned to their respective positions in the ganglion.B, Spatial representations of the dendritic areas of GI1 that overlap with h4 (brown dots) and the axonal areas of h4 that overlap with GI1 (purple dots) at ε = 6 μm (18 and 19%, respectively). C, A dendritic tree of GI1 (brown) and an axonal tree of h4 (purple) from GI2-ablated animals are shown spatially aligned.D, Spatial representations of the overlap between dendritic trees of GI1 and axonal trees of h4in the GI2-ablated animals shown at ε = 6 μm (14 and 27%, respectively). Scale bar, 100 μm. E, Graph of the one-way HM of GI1 in h4 from control animals (n = 25 comparisons from 5 animals for each group; solid line) and of GI1 in h4 from GI2-ablated animals (n = 25 comparisons from 5 animals; dotted line). We found no significant differences between the two groups (ANCOVA; p > 0.05). F, Graph of the one-way HM of h4 in GI1 from control animals (n = 25 comparisons from 5 animals;solid line) and of h4 in GI1from GI2-ablated animals (n = 25 comparisons from 5 animals for each group; dotted line). We found no significant differences between the two groups (ANCOVA;p > 0.05).

