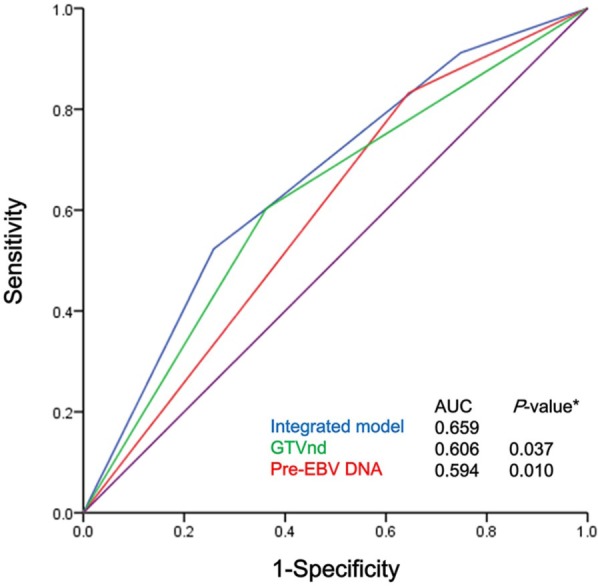
Figure 2.

ROC curves for the cut-off points for the GTVnd (>20 ml versus ⩽20 ml) and pre-EBV DNA (>2000 copies/ml versus ⩽ 2000 copies/ml) and the integrated model for all NPC patients (n = 1500).
*Compared with the integrated model.
GTVnd, gross tumor volume of lymph nodes; pre-EBV, pretreatment plasma Epstein–Barr virus DNA; ROC, receiver operator characteristic.
