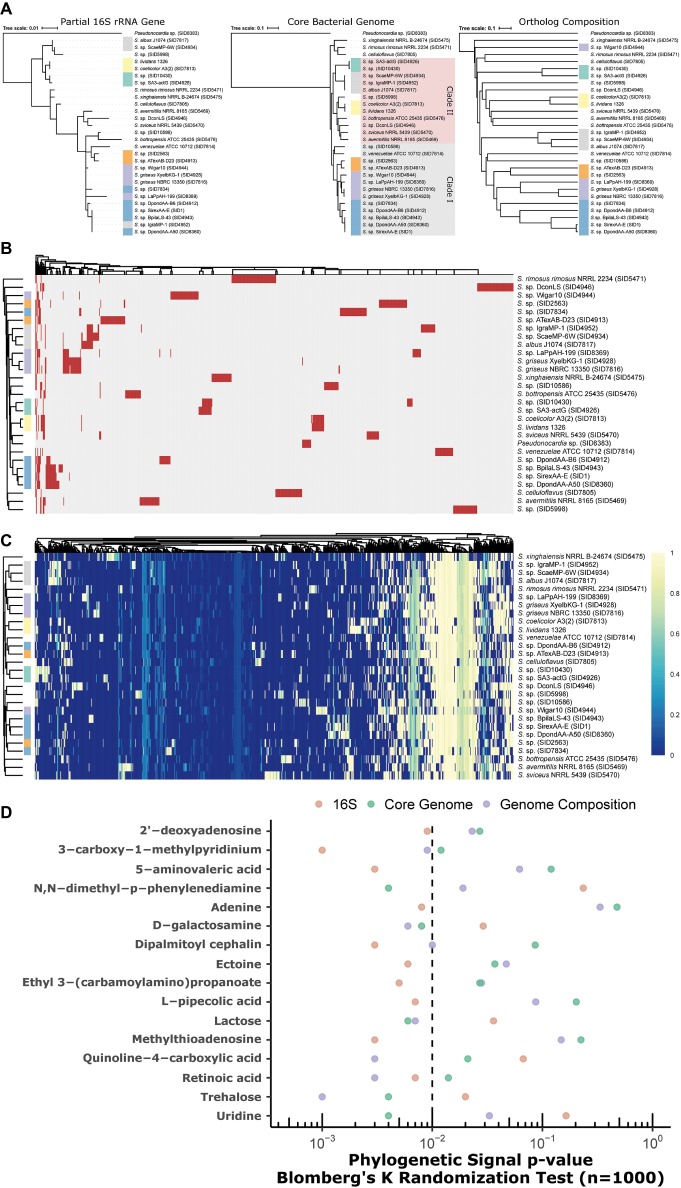
Figure 6.
(A) Discordant relationships between Streptomyces by different methods, partial 16S (V3 and V4), core genome phylogeny, or Jaccard similarity of genome composition (orthologs). (B) Presence/absence heatmap of biosynthetic gene cluster families (GCFs) in Streptomyces. Rows = strains, columns = GCFs. red = present; gray = absent. (C) Genome-metabolite MAGI scores (colors; scaled 0 to 1) in Streptomyces. Rows = strains; columns = reactions; clustering = Euclidean. (B,C) Annotation bar for strains (colors on row dendrogram) correspond to clades designated in (A) above. (D) Phylogenetic signal of metabolites with respect to trees in (A) above. Significance is marked by p < 0.01 (left of the dashed line).

