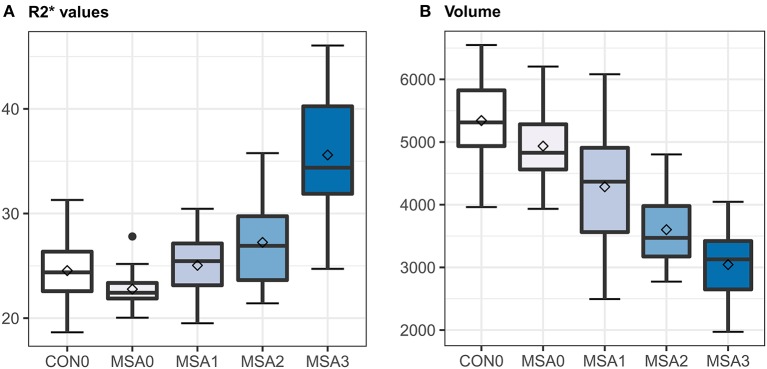
Figure 2.
Box and whisker plots illustrating ranges of putaminal R2* values (A) and volume (B). CON0 = control putamen with visual rating 0; MSA0, 1, 2, or 3 = MSA putamen with visual rating 0, 1, 2, or 3; horizontal bar in the boxes = median values; squares in the boxes = mean values; error bars = minimal and maximal values.

