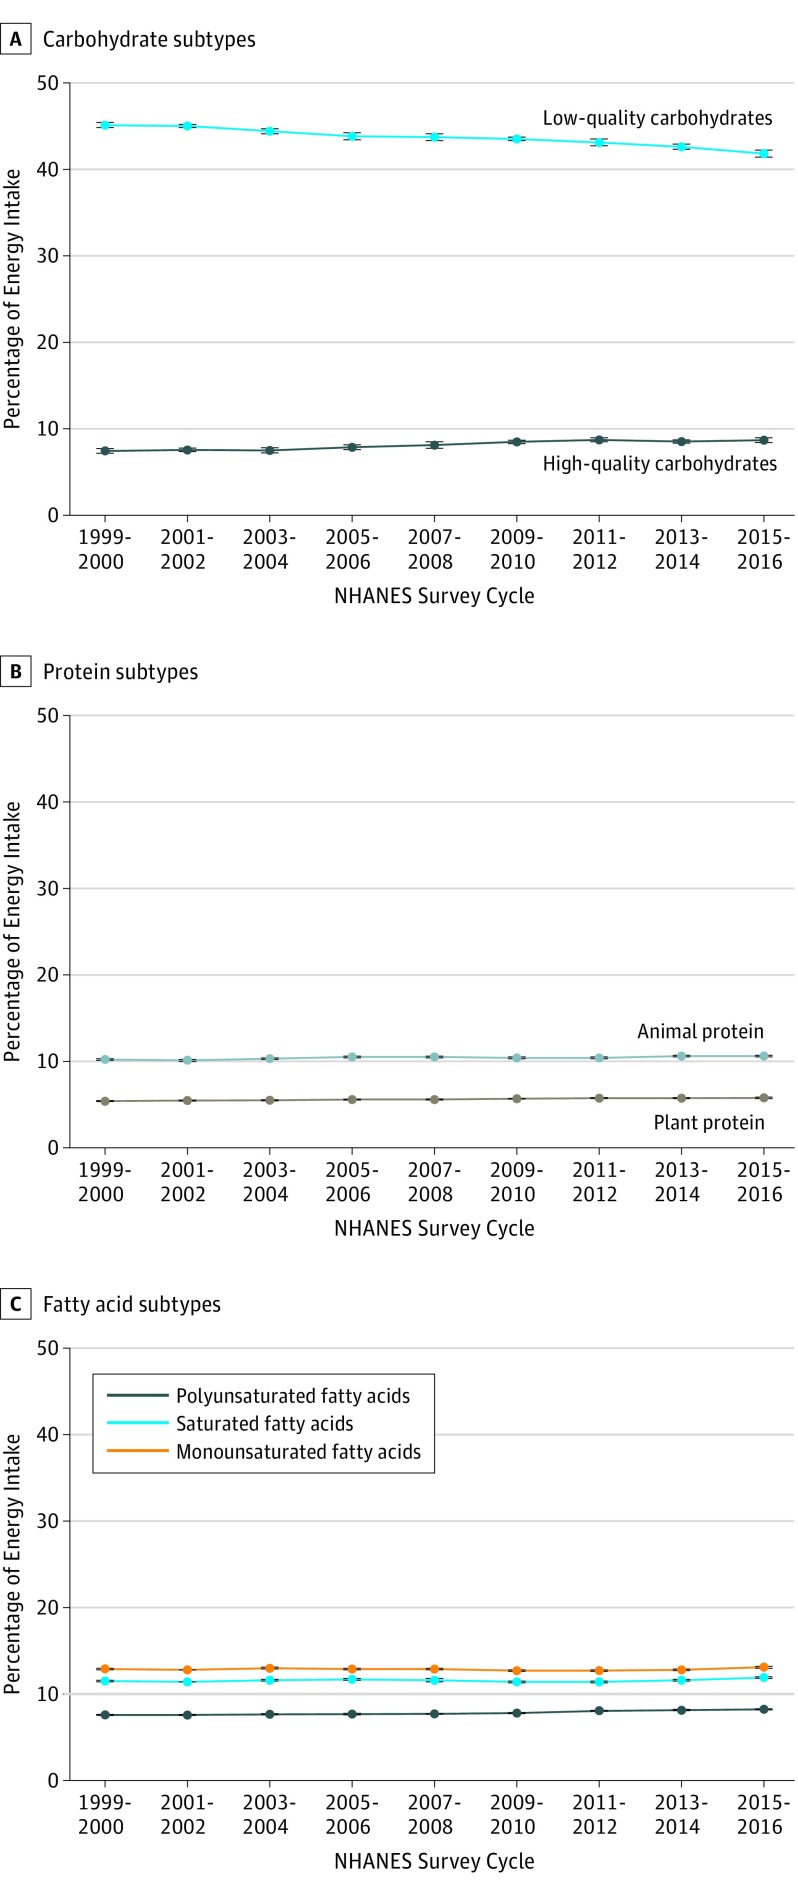
Figure 2. Trends in Estimated Percentage of Energy Intake From Subtypes of Carbohydrates, Protein, and Fat Among US Adults Aged 20 Years or Older by NHANES Survey Cycle From 1999-2000 to 2015-2016.
NHANES indicates National Health and Nutrition Examination Survey. Data were adjusted for NHANES survey weights to be nationally representative. Error bars indicate 95% CIs. P < .001 for trend for all (decrease for low-quality carbohydrates; increase for all others).

