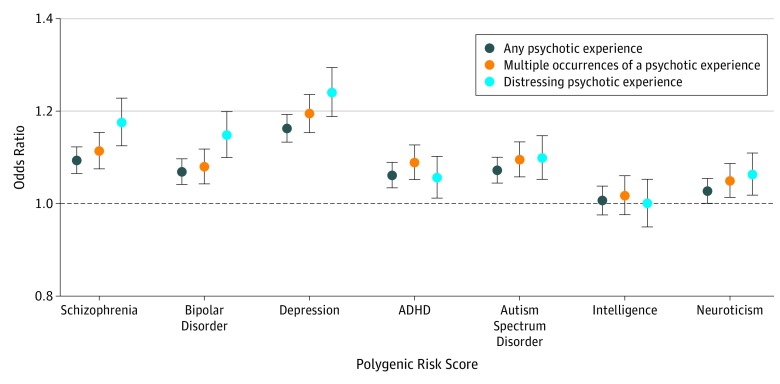
Figure 3. Polygenic Risk Score (PRS) Analysis.
The x-axis refers to the PRS tested (schizophrenia, bipolar disorder, major depressive disorder, attention deficit/hyperactivity disorder [ADHD], autism spectrum disorder, neuroticism, and intelligence), and the y-axis represents the odds ratio (OR). Points display the OR and 95% CIs (error bars) for each PRS (P < .05 single-nucleotide polymorphism [SNP] inclusion threshold) regressed against each psychotic experience phenotype. Plots displaying multiple P value SNP inclusion thresholds are shown in eFigures 8 and 9 in the Supplement.

