Figure 5.

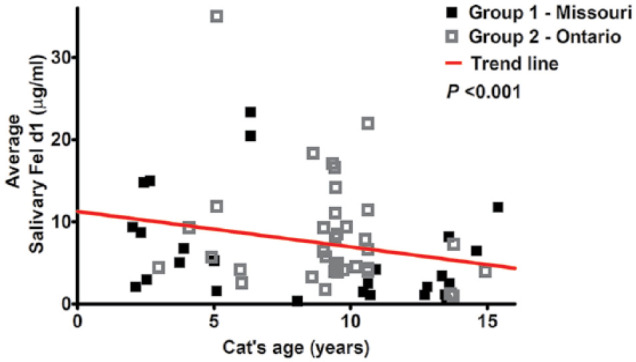
Graphical representation of linear mixed-effects model for salivary Fel d1 in relation to a cat’s age; trend line and P value obtained for groups 1 and 2 combined (n = 64; P <0.001)

Graphical representation of linear mixed-effects model for salivary Fel d1 in relation to a cat’s age; trend line and P value obtained for groups 1 and 2 combined (n = 64; P <0.001)