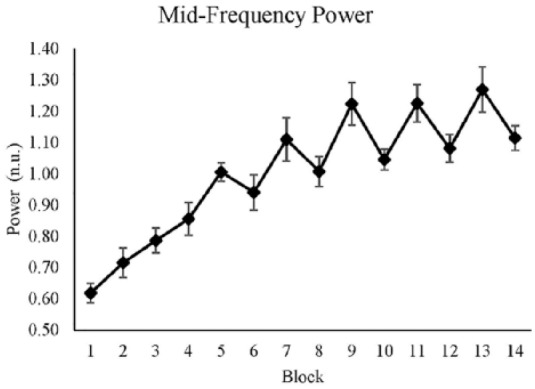
Figure 4.

Average midfrequency power for each block. The y-axis shows the normalized value of the midfrequency power, and the x-axis shows blocks, where even blocks are the reward conditions. Standard errors are represented by the error bars in each block. The figure was plotted with raw values.
