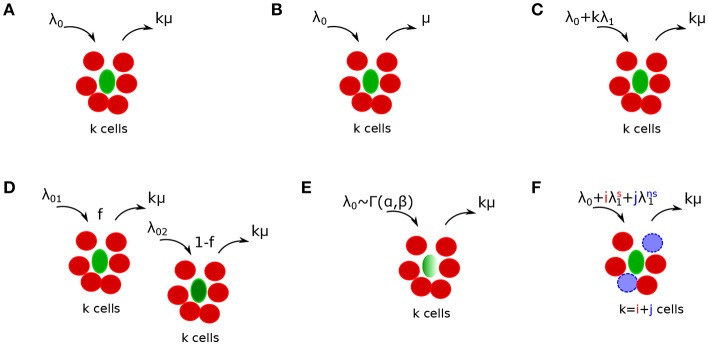
Figure 2.
Schematics of alternative mathematical models of T cell cluster formation around Plasmodium yoelii (Py)-infected hepatocytes in mice. Py-specific T cells are labeled by red (disks), T cells of irrelevant specificity are colored by blue (dashed disks), and parasites are labeled by green (ovals). In the models the rate of T cell entry into a cluster is denoted as λk and rate of exit from the cluster is denoted as μk. Mathematical models include a random entry/exit (Poisson) model (A, Equation (4), λk = λ0 and μk = kμ), a density-independent (DI) exit model (B, Equation (5), λk = λ0 and μk = μ), a density-dependent (DD) recruitment model (C, Equation (6), λk = λ0 + kλ1 and μk = kμ), a “two populations” model in which infected hepatocytes have either of two different “attractiveness” levels determined by λ01 and λ02 (D, Equation (11), μk = kμ), a “gamma” model, in which the entry rate into clusters is distributed according to a gamma distribution with α and β being the rate and shape parameters [E, Equations (12–15), μk = kμ], and finally a “co-clustering” model, in which clusters are formed by Plasmodium-specific T cells or T cells or irrelevant specificity (non-specific T cells) [F, Equations (12–15), and μk = kμ]. For some of our analyses we characterized the model behavior using the ratio of entry to exit rates denoted as a relative entry rate θk = λk/μk.

