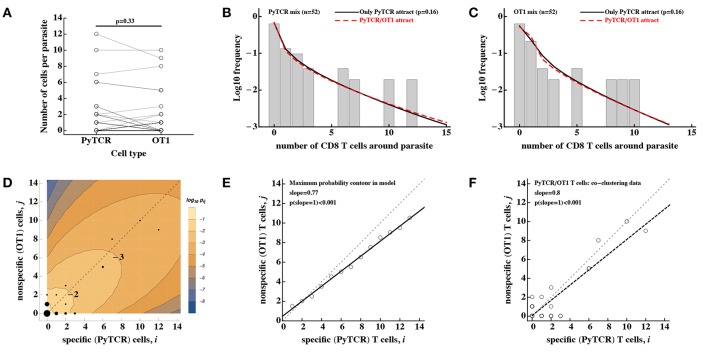
Figure 5.
No evidence that activated CD8 T cells of irrelevant specificity play a significant role in cluster formation. Experiments were performed as described in Figure 4A and the number of T cells, specific to Py (PyTCR) and T cells of irrelevant specificity (OT1), found in a 40 μm radius of n = 52 randomly chosen parasites in the liver was counted using intravital imaging. (A) No difference in the number of Py-specific and non-specific T cells found around Py liver stages (Wilcoxon signed rank test). (B,C) We fitted a series of mathematical models assuming how Py-specific or non-specific T cells mediate attraction to the infection site [co-clustering model, Equations (12–15)], and fits of two models where either only PyTCR T cells attract (solid lines, B,C) or both PyTCR and OT1 T cells attract (dashed lines, B,C) as well as data (bars) are shown. A simpler model in which only PyTCR T cells mediate attraction describes the data as well as the more complex model in which both types of T cells attract to the cluster (likelihood ratio test, , p = 0.16). Bars in (B,C) are the observed frequencies of parasites with a variable number of PyTCR (B) or OT1 (C) T cells. In (D) we show the data (points) and predictions of the model in which only Py-specific T cells attract all activated cells to the infection site (contours); model prediction is the log10 Pij(6) where Pij is the probability to observe i Py-specific and j non-specific T cells around the parasite at t = 6h after T cell transfer. The point size represent the number of parasites having a given number of PyTCR/OT1 cells in 40 μm radius, and thin dashed lines shows the line with slope = 1. In (E) points represent the prediction of the model on the number of PyTCR/OT1 T cells in clusters where Pij reaches maximum for i + j = const (see the contour plot in D). The solid line represents a regression line for the model predictions with slope = 0.76 which is significantly different from 1 (t-test, p < 0.001) and the dashed line shows the line with slope = 1. In (F) points represent co-clustering data of PyTCR and OT1 T cells around parasites (the same data are shown in D). Solid line represents a regression line with slope = 0.8 which is significantly different from 1 (t-test, p < 0.001). Results in (D–F) indicate model-predicted slight bias toward clustering of a larger number of PyTCR T cells which is not directly observed in the data (A).

