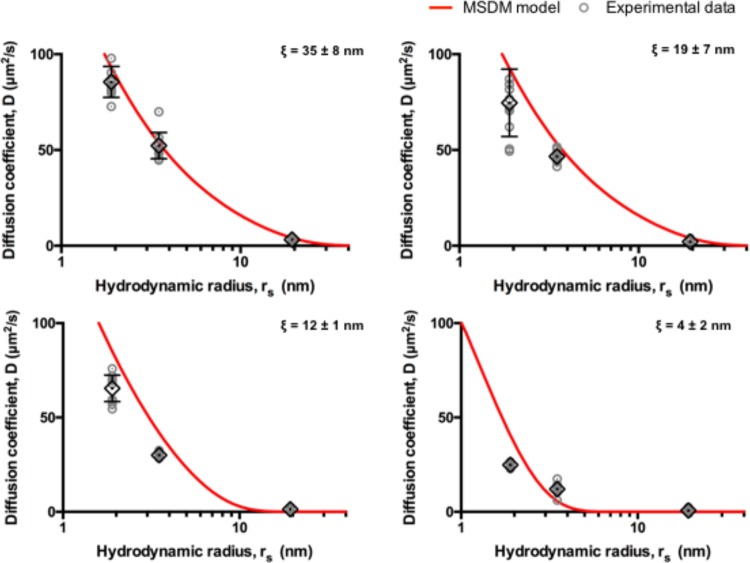
Figure 3.
Diffusivities predicted by the MSDM model compared against experimentally obtained diffusivities. Experimental diffusivities (gray circles; error bars denote mean ± s.d.; n = 10) and predicted diffusivities (solid red lines) are plotted against solute hydrodynamic radius (rs) for PEG hydrogels with different mesh sizes (ξ).

