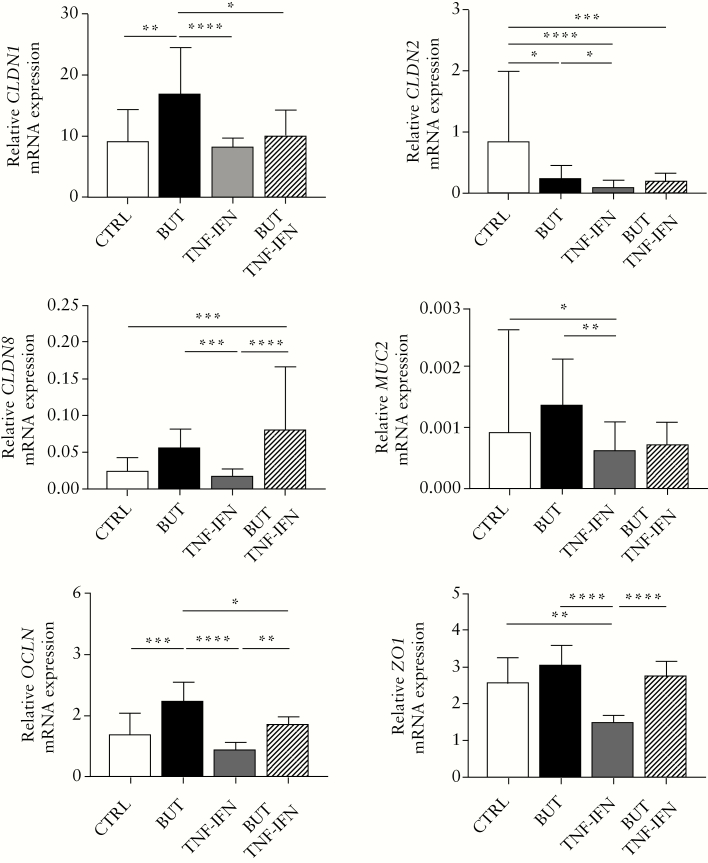
Figure 3.
Bar plots showing the relative mRNA expression levels of six intestinal barrier genes as evaluated with qRT-PCR in monolayer cultures from UC patients [n = 10] and non-UC controls [n = 10] treated with medium [CTRL, white bars], 8 mM sodium butyrate [BUT, black bars], 25 ng/ml TNFα and IFNγ [TNF-IFN, grey bars], or 8 mM sodium butyrate + 25 ng/ml TNFα and IFNγ [BUT + TNF-IFN, striped line bars]. Treatment had a significant effect on all barrier gene levels [Friedman test], with the effect depending on the gene and treatment condition [post-hoc Dunn’s tests with adjustment for multiple comparisons]. The expression levels were normalised to beta-actin [ACTB], and results are shown as medians with interquartile ranges. Significant differences for the post-hoc tests are indicated. UC, ulcerative colitis; TNF, tumour necrosis factor; IFN, interferon; qRT_PCR, quantitative real-time polymerase chain reaction; CTRL, negative control; BUT, 8 mM butyrate. *adj.p <0.05; **adj.p <0.01; ***adj.p <0.001; ****adj.p <0.0001.

