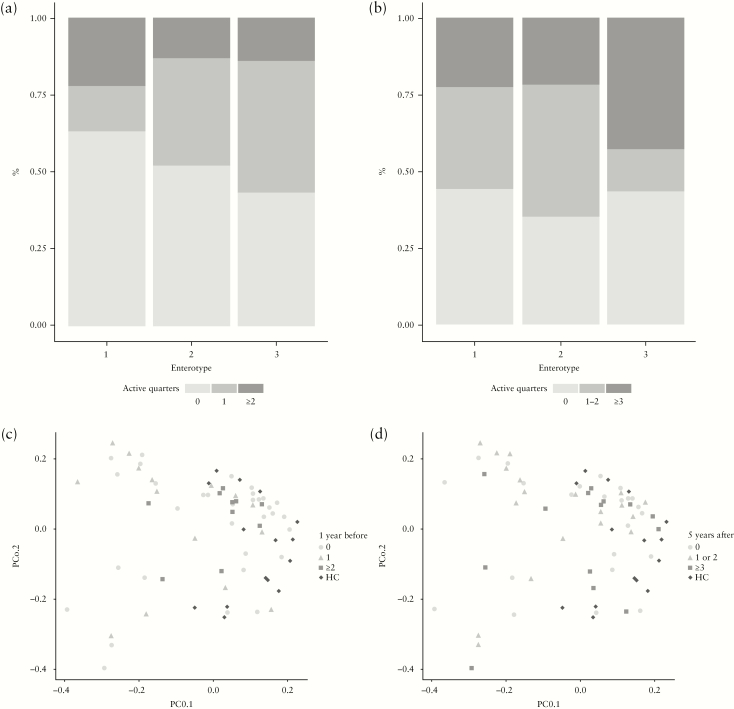
Figure 4.
The number of active disease quarters is not associated with the microbial community structure: [a] bar plot representing the proportion of CD patients among each enterotype with 0, 1, or ≥2 active quarters within the year prior to inclusion; [b] bar plot depicting the proportion of CD patients among each of the enterotypes with 0, 1–2, or ≥3 active quarters in the 5 years after inclusion; [c+d] PCoA based on weighted UniFrac distance metric of baseline faecal microbiota samples of healthy controls and Crohn’s disease patients. Samples are coloured based on the number of active quarters during [c] 1 year before inclusion, and [d] 5 years after inclusion.

