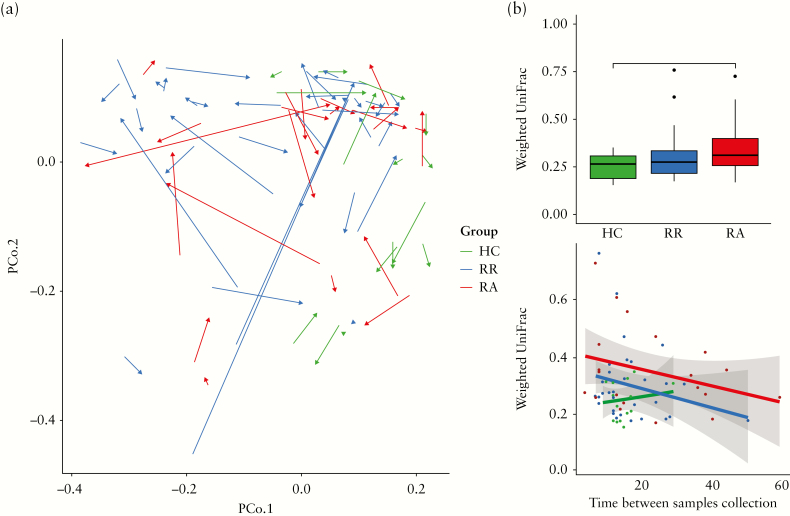
Figure 6.
[a] PcoA based on within-subject weighted Unifrac distance of faecal microbiota at baseline [T1] and second sampling time-point [T2]. Samples of healthy controls [HCs] are indicated in green, whereas samples of CD patients that remain in remission [RR] are indicated in blue and patients that develop an exacerbation [RA] in red. The arrows connect two samples from the same individual. The direction goes from T1 to T2. [b] Healthy controls show a statistically significantly smaller within-subject UniFrac distance between the two subsequent time-points, when compared with patients that develop an exacerbation [RA], whereas no difference is observed when compared with patients that remain in remission. Significance was tested using the Wilcoxson Signed-Ranks Test; * indicates p < 0.05. [c] There is no association between the within-subject distance and the actual time [in weeks] between subsequent sampling time-points as assessed by a linear model.

