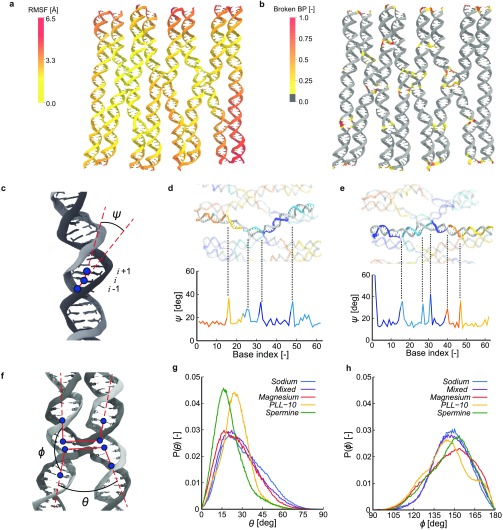
Figure 2.
Structural analysis of the DNA origami rectangle. (a) Root-mean-square fluctuations (RMSF) per nucleotide center of mass mapped onto the DNA’s time averaged structure for the Magnesium simulation. (b) Fraction of time the base pairs are broken for the Magnesium simulation mapped onto the DNA’s time averaged structure. (c) Schematic for the definition of helix angles ψi for base index i. (d, e) Helix angles ψi in the Sodium simulation for helices 4 and 5, respectively. (f) Schematic for the definition of crossover angles θ and ϕ. (g) Probability distributions of the angle θ for all five simulations. (h) Probability distributions of the angle ϕ for all five simulations.

