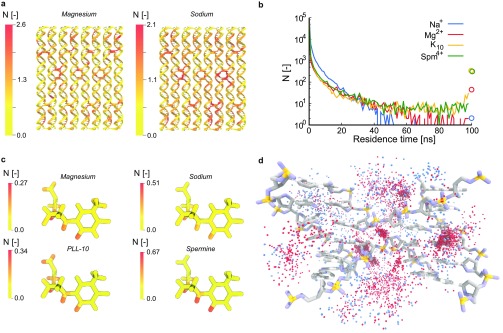
Figure 3.
Analysis of binding of ions to the DNA origami. (a) Number of ions within 5 Å of each nucleotide averaged over time in the Magnesium and the Sodium simulation, respectively, mapped onto the initial origami structure. (b) Residence times of ions within 12 Å of the DNA origami. Circles at 100 ns indicate ions that are near the DNA during the full simulation time. (c) Number of ions within 5 Å of each atom in thymine, averaged over time and all thymine nucleotides. (d) Superposition of 100 frames of a crossover region in the Mixed simulation showing Mg2+ (red) binding at more defined regions and Na+ (blue) binding further away at less defined positions.

