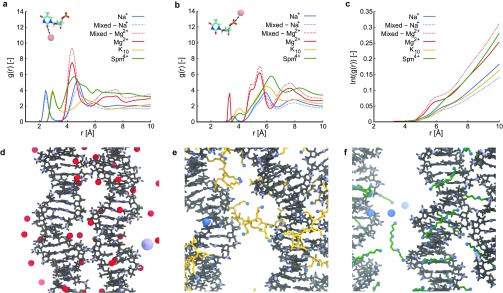
Figure 4.
Illustration of typical binding of ions to DNA origami. (a) Radial distribution function between ions and atoms located in the minor groove of the DNA origami helix. (b) Radial distribution function between ions and phospohorus atoms in the DNA backbone. (c) Integral of the radial distribution function between ions and all phosphorus atoms in the nucleotides forming crossover junctions. (d–f) Zoomed in simulation snapshots illustrating typical binding of Mg2+, K10, and Spm4+, respectively, with DNA origami shown in gray, Mg2+ in red, K10 in yellow, Spm4+ in green, and nitrogen in blue.

