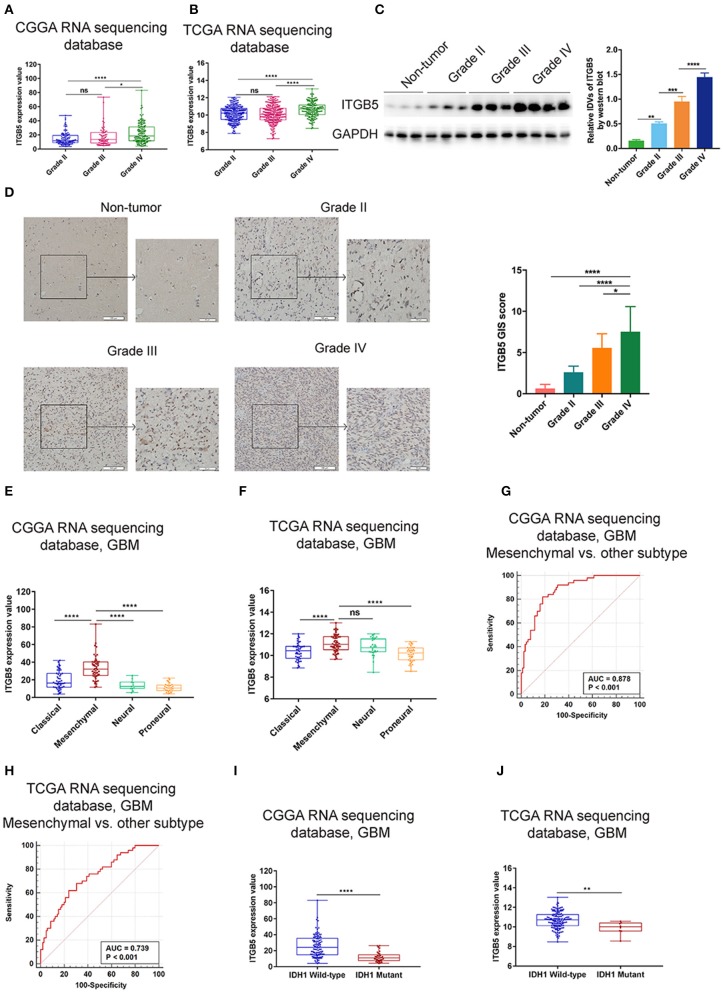
Figure 2.
Elevated ITGB5 expression is associated with progressive malignancy and a mesenchymal subtype in glioma. (A,B) ITGB5 expression according to glioma grade (A, CGGA RNA-seq; B, TCGA RNA-seq). ns, P > 0.05; *P < 0.05; **** P < 0.0001 (one-way analysis of variance [ANOVA]). (C) ITGB5 expression is elevated according to glioma grade, as determined by western blotting. **P < 0.01; ***P < 0.001; ****P < 0.0001 (one-way ANOVA). (D) Representative images (left panel) of ITGB5 expression in clinical specimens and quantification of staining intensity (right panel). *P < 0.05; ****P < 0.0001 (one-way ANOVA). (E,F) ITGB5 expression is highest in the mesenchymal subtype of GBM (E, CGGA RNA-seq; F, TCGA RNA-seq). ns, P > 0.05; ****P < 0.0001 (one-way ANOVA). (G,H) ROC curve for evaluating the sensitivity and specificity of ITGB5 as a diagnostic marker for the mesenchymal subtype of GBM vs. other subtypes (G, CGGA RNAseq, area under the ROC curve [AUC]: 0.878, P < 0.001; H, TCGA RNAseq, AUC: 0.739, P < 0.001). (I,J) ITGB5 expression is elevated in IDH1-wild-type as compared to IDH1-mutant GBM (I, CGGA RNAseq; J, TCGA RNAseq, **P < 0.01; ****P < 0.0001 [t-test]).

