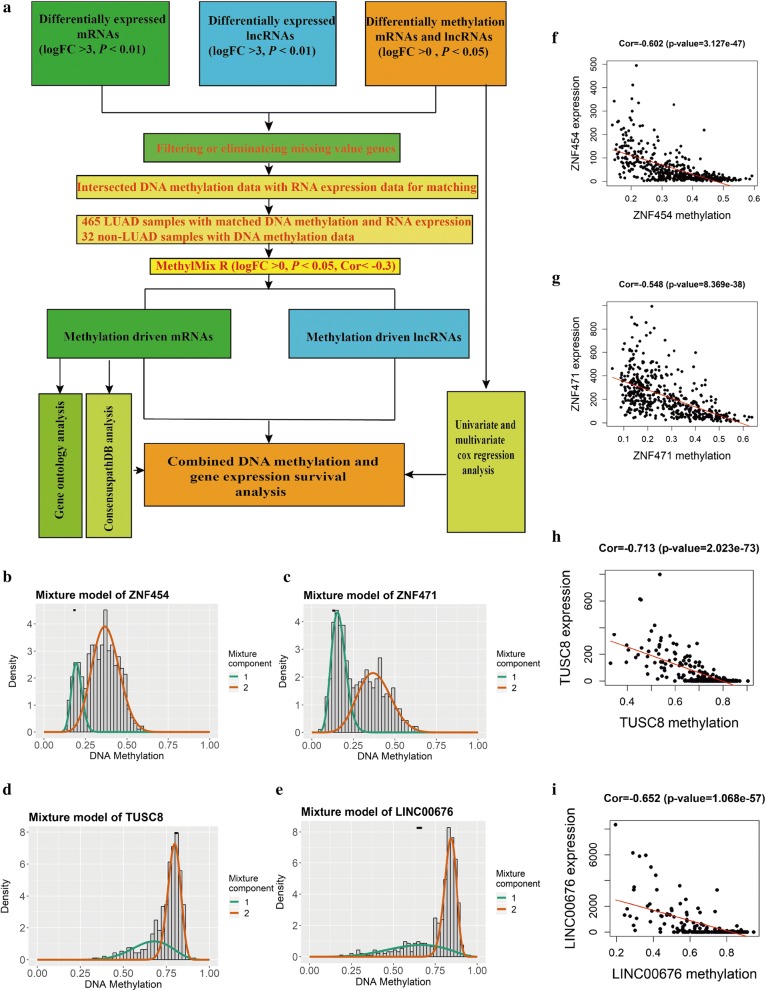
Fig. 1.
Identification of top hypermethylated and hypomethylated mRNAs and lncRNAs in LUAD. a A flow diagram of the exploration of methylation-driven mRNA and lncRNA in LUAD. b–e The methylation degree when comparing cancer patients to normal patients in LUAD. The red curve indicates the methylation degree from the cancer group, the green curve indicates the methylation degree from the normal group, and the black line above the figure is the distribution of methylation levels in normal patients. f–i The correlation between methylation and gene expression in methylation-driven mRNAs and lncRNAs

