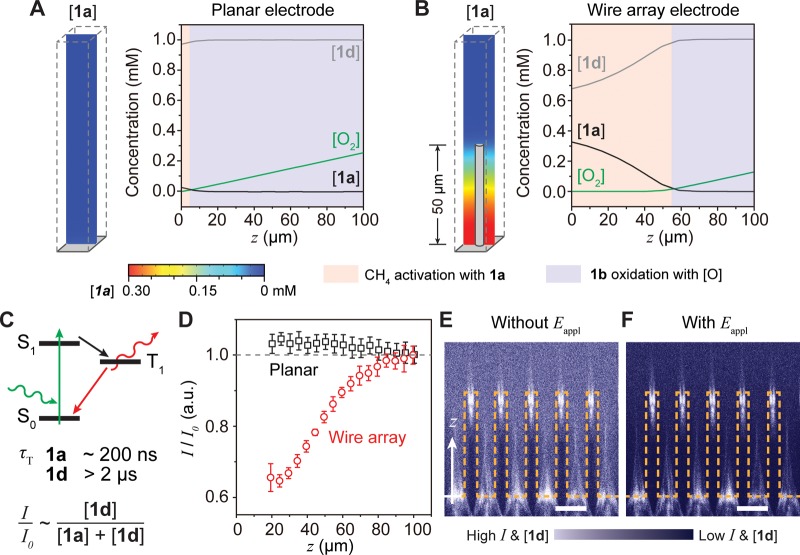
Figure 3.
Numerical simulations and experimental validation of a microscopic concentration gradient for CH4 activation. (A, B) Simulated concentration gradients of O2, 1a, and 1d ([O2], [1a], and [1d], respectively) near a planar (A) and wire array (B) electrode. z, distance away from electrode surface; Eappl= −1.5 V vs SCE. (C) Jablonski diagram illustrating potential phosphorescence emission of 1a and 1d. The triplet state lifetime (τT) of 1a is much shorter than the one of 1d. I/I0, normalized emission intensity of phosphorescence. (D) Experimentally determined I/I0 versus z for planar (black) and wire array (red). 0.1 mM 1d in the bulk solution, 0.1 M TBAClO4 in 1,2-DFB, Eappl= −1.5 V vs SCE. (E, F) The corresponding cross-sectional heatmaps of unnormalized phosphorescence intensity without (E) and with (F) Eappl. The surface of the Si wire array is delineated in yellow. Scale bar, 15 μm.

