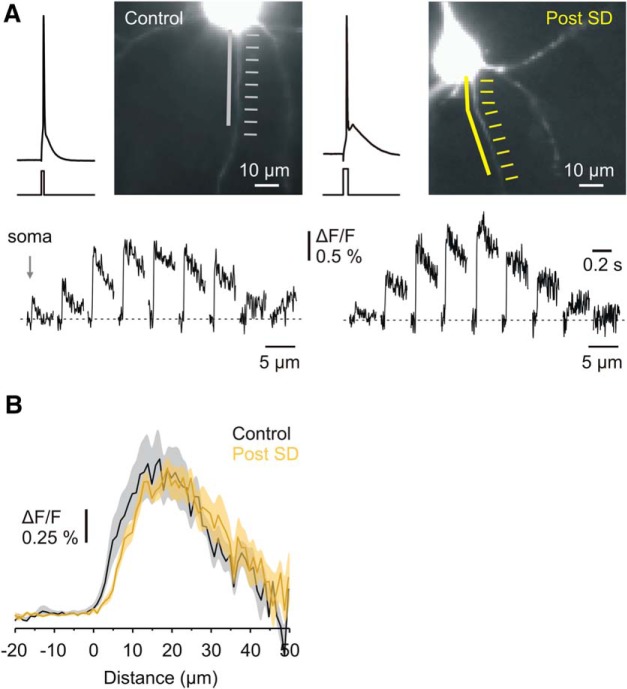
Figure 5.
Recovery from SD is not accompanied by an altered distribution of AP-evoked Na+ flux along the proximal axon. A, Representative images obtained during Na+ imaging experiments from control neurons (left) and neurons that have recovered from SD (right). The white (control) and yellow (recovered) arrows indicate the regions from where fluorescence measurements were obtained. Lines indicate the axonal regions where fast-rising fluorescent signals were detected. Bottom, Averaged ΔF/F transients (n = 30 sweeps) elicited by a single AP in the 5-μm-long axonal segments. B, Mean AP evoked Na+ elevations in the soma and axon of control (gray, n = 11) and recovered (yellow, n = 16) neurons. Plotted are mean peak ΔF/F ± SEM values obtained from 1-μm-long segments in the soma and along the axon.

