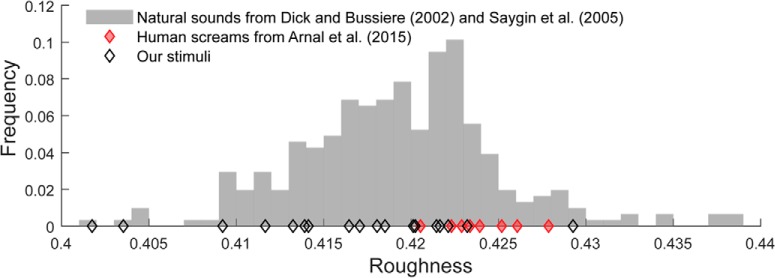
Figure 3.
To estimate the range of “roughness” values that we might expect to encounter in the environment, we quantified roughness (see Materials and Methods) for a large set of diverse natural sounds (N = 274; sound duration = 500 ms to match that in the present experiment) from a set described previously (Dick and Bussiere, 2002; Saygin et al., 2005). This information is presented in histogram form (gray bars). Roughness values for the sounds used in the present study are indicated by black diamonds. We also include roughness calculated for the scream sounds from Arnal et al. (2015) (red diamonds). This analysis confirms that the set of sounds we used spans the range of roughness obtained from a diverse set of environmental sounds. The sounds at the top of the roughness range in our set, overlap with the roughness range defined by the scream sounds from Arnal et al. (2015).

