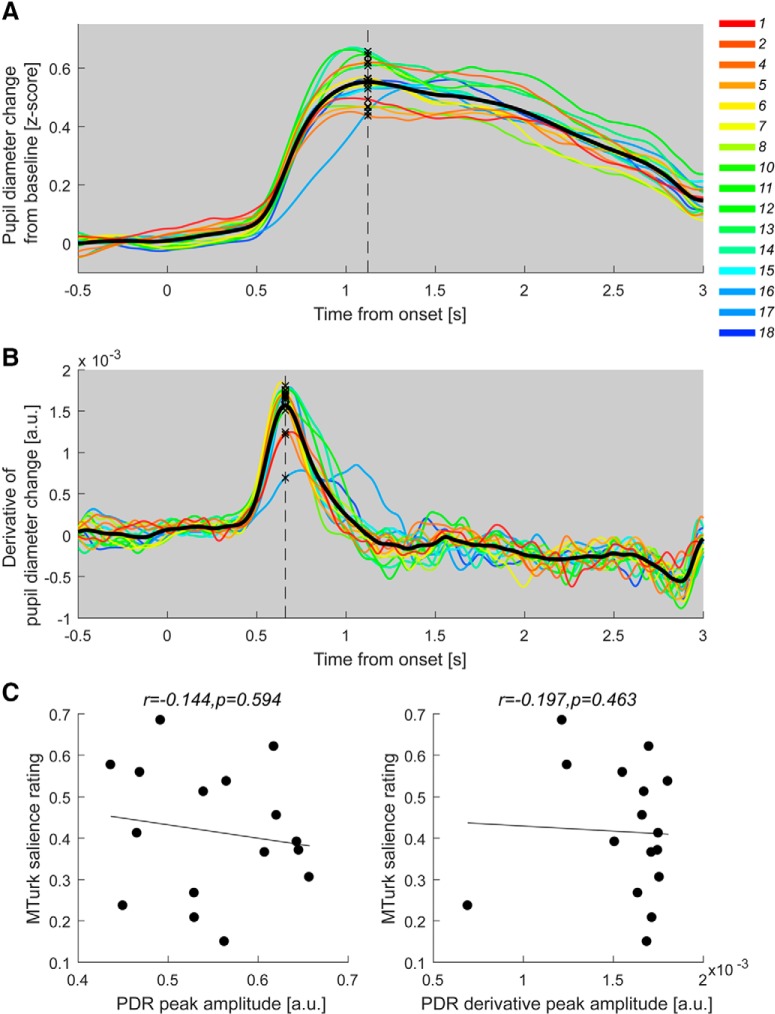
Figure 5.
Measures of pupillary dilation are not correlated with crowd-sourced salience. A, The PDR obtained from the full group (N = 30). The solid lines represent the average normalized pupil diameter as a function of time relative to the onset of the sound. The line color indicates the MTurk salience ranking; more salient sounds are labeled in increasingly warmer colors. The solid black line is the grand-average across all conditions. The dashed line marks the peak average PDR. B, The PDR derivative. C, Correlations between crowd-sourced salience and peak PDR amplitude (left) and maximum of PDR derivative (right). None of the effects were significant. A similar analysis based on sound-token specific peaks (as opposed to based on the grand average) also did not yield significant effects. All correlations are conducted using the Spearman rank method.

