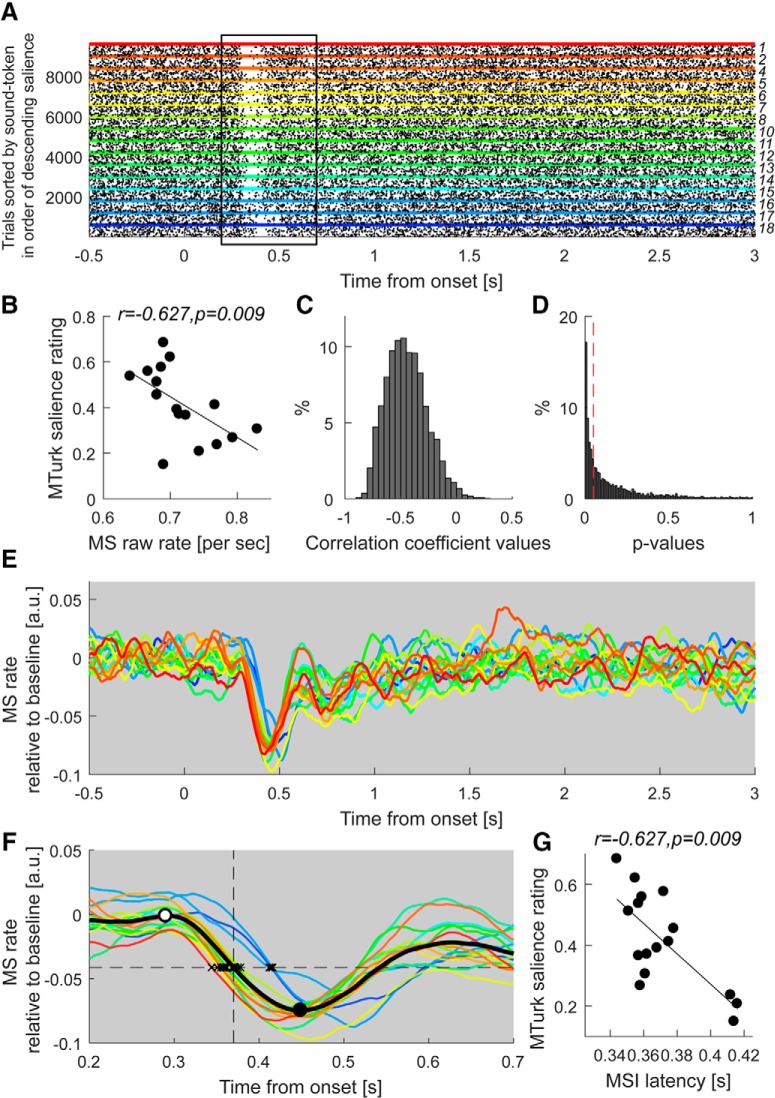
Figure 6.
MSI is correlated with crowd-sourced salience. A, Raster plot of microsaccade events (pooled across all participants) as a function of time relative to sound onset. The y-axis represents single trials; each dot indicates the onset of a microsaccade. Trials are grouped by sound-token and arranged according to the MTurk-derived salience scale (increasingly hot colors indicate rising salience). The region of MSI, between 0.2 and 0.7 s post-sound onset, is highlighted with a black rectangle. B, Over this time interval, the MS rate (number of MS events per second) is correlated significantly with the crowd-sourced salience rating. The result of bootstrap resampling is shown as the distribution of correlation coefficients (C) and the distribution of associated p-values (D). The vertical red dashed line indicates p = 0.05. E, Average microsaccade rate time series for each sound (F) focusing on the MSI region. The solid black curve is the grand-average MS rate across all sound tokens. MSI commences at ∼0.3 s after sound onset (open circle) and peaks around 0.45 s (solid black circle). The horizontal dashed line indicates the mid-slope of the grand average (amplitude = −0.04 a.u., time = 0.37 s). Black crosses mark the time at which the response to each sound intersects with this line, as a measure of MSI latency. G, Correlation between these values and the crowd-sourced salience rating. All correlations are conducted using the Spearman rank method. Note identical correlation values in G and B are a chance occurrence (the two analyses are independent).

