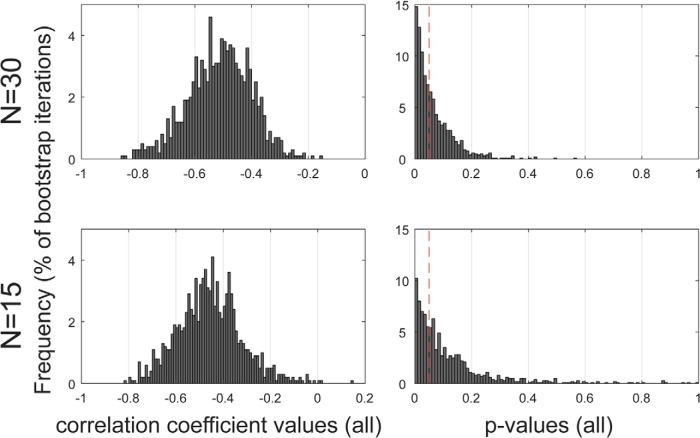
Figure 7.
Estimation of the stability of the correlation between MSI latency and crowd-sourced salience. Left, Distribution of the Spearman correlation coefficients derived from resampling analyses with subgroup sizes of 15 or 30 participants. In both cases, the distribution peaks around r = −0.5. Right, Distribution of the p-values associated with each n. The red vertical dashed line indicates p = 0.05. A uniform distribution is expected under the null. The left skewed pattern observed here indicates a true effect. Skewness was formally confirmed by a χ2 test on p-values <0.05 (n = 30: χ2(1066) = 1405.42, p < 0.0001; n = 15: χ2(748) = 903.2, p < 0.0001).

