Figure 1.

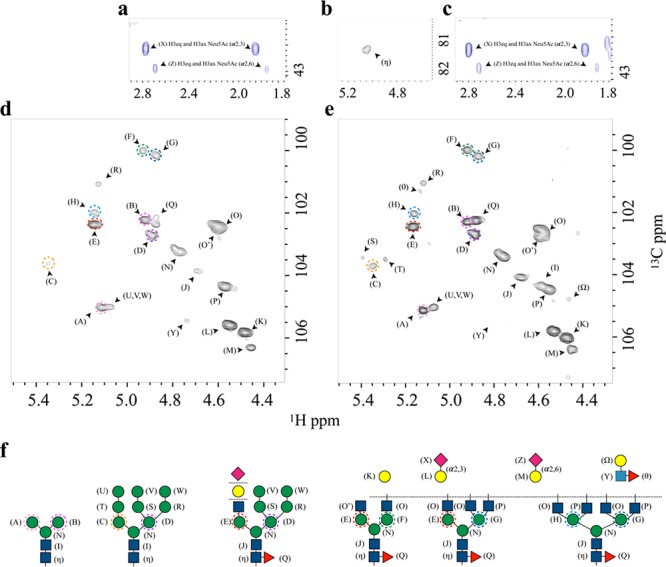
Glycan content. FcεRIα glycosylation patterns as deduced by direct analysis of the [1H,13C]-HSQC NMR spectra. Expansion of the region containing the axial and equatorial H3 protons of the Neu5Ac residues in the folded (a) and the unfolded (c) state. (b) Expansion of the spectral region showing the anomeric (C1–H1) cross-peaks of the Asn-linked GlcNAc 1, which appears only under denaturing conditions. (d, e) Expansion of the spectral region showing the anomeric (C1–H1) cross-peaks of the linked saccharides in native and denaturing conditions, respectively. (f) Schematic representation of the different N-glycans identified. Each monosaccharide with a unique 1H,13C resonance is labeled with a different letter. The Man residues in the antennae (A–H) are further identified through different colored dashed circles. These residues differ in terms of their chemical linkages and, consequently, in their NMR chemical shifts.
