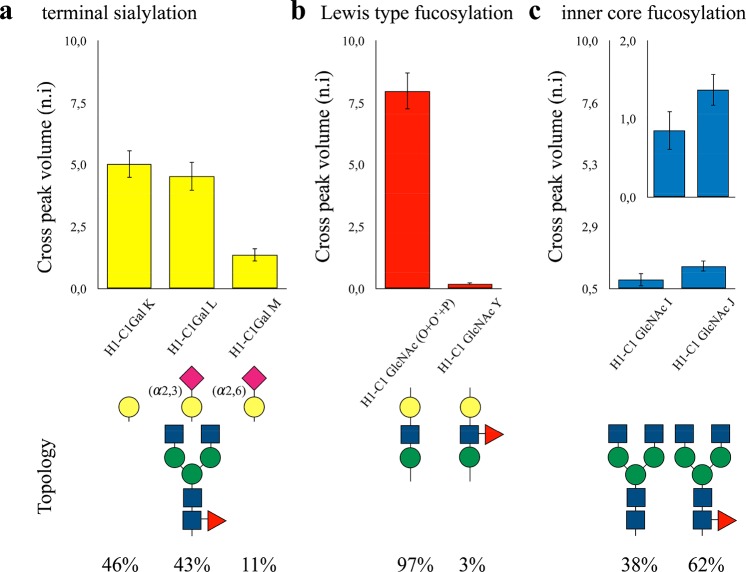
Figure 3.
Specific glycan epitope analysis. The different biorelevant N-glycans and epitopes contained in FcεRIα, together with their relevant abundance. (a) Estimation of the specific terminal sialylation obtained by comparing the cross-peak intensities of the galactose signals measured for the terminal Gal, Neu5Ac(α2–3)Gal, and Neu5Ac(α2–6)Gal moieties.35 (b) Estimation of the degree of fucosylation in the antennae as well as its relative abundance, calculated comparing (O′ + O + P) with (Y). (c) Estimation of the degree of inner-core fucosylation, calculated comparing (I) and (J). The lowest signal intensities observed for the GlcNAc2 residues are related to their different rotational motion effective correlation times with respect to the terminal residues, which are fairly more mobile. The inset plot in a different scale clarifies the relative abundance of this glycan modification.

