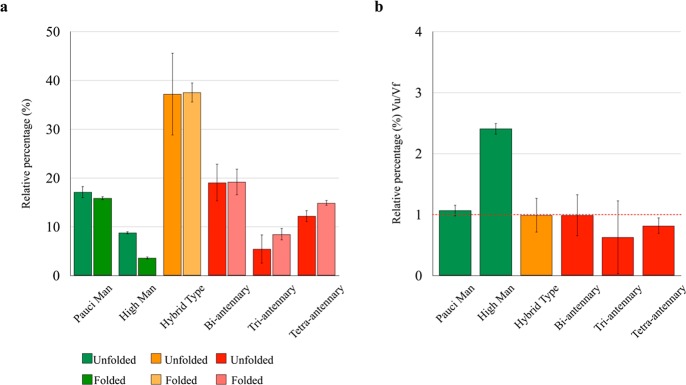
Figure 4.
Comparison of the N-glycan manifold in FcεRIα under denaturing and native-preserving conditions. (a) Relative percentage of the different types of N-glycans in FcεRIα, as determined in denatured and native conditions. Under denaturing conditions, the percentage always reflects the N-glycan composition while the apparent value obtained in native-preserving solvent is lowered when the N-glycan is interacting with the protein moiety. (b) Ratio of the population in the native and denatured states for the different N-glycan types, where the high mannoses show a statistically significant deviation from unity. Error bars are obtained from independent triplicate measurements.

