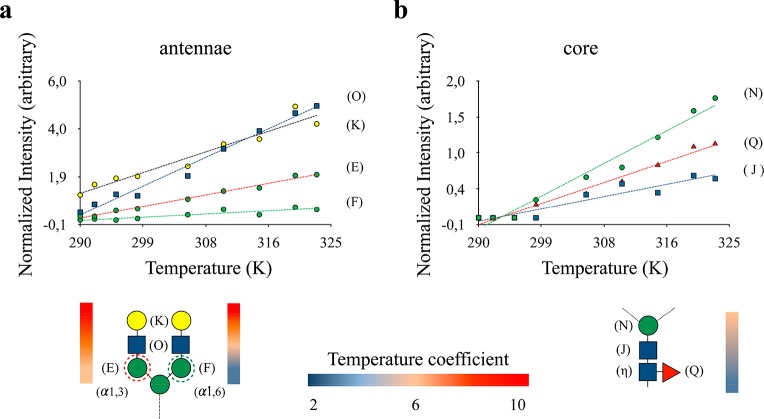
Figure 5.
Analysis of N-glycans dynamics. The plots represent the signal intensities measured for the anomeric C1–H1 cross-peaks of each monosaccharide for a biantennary N-glycan, recorded as a function of temperature. (a) The antennae monosaccharides show intense resonances, which increase with temperature in a linear way. The differences among the sugar positions, at either the 1,3 or 1,6 arms, are also highlighted. (b) The inner-core sugars (Fuc, GlcNAc2, and Man3) show extremely weak signals.

