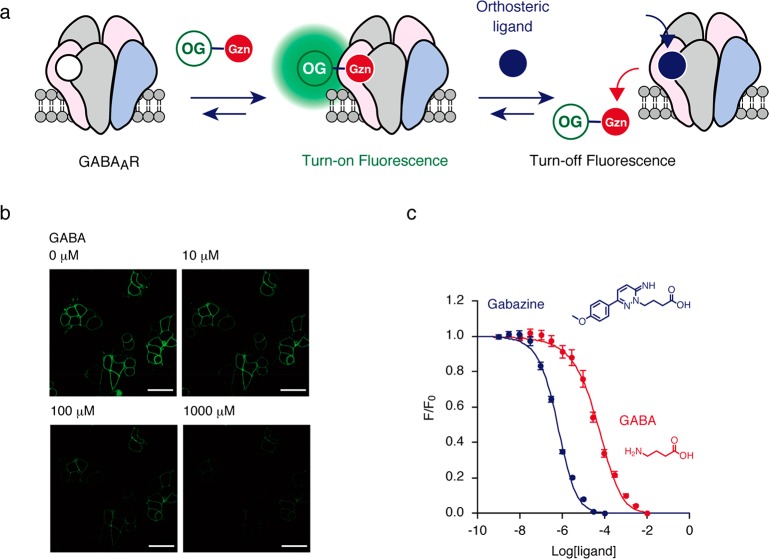
Figure 2.
Competitive binding assay of orthosteric ligands using Gzn-OG. (a) Schematic illustration of competitive binding assay using Gzn-OG. (b) Confocal live cell imaging of HEK293T cells transfected with GABAAR(α1/β3/γ2) upon addition of Gzn-OG (100 nM) at various concentrations of GABA. Scale bar = 40 μm. (c) Plots of fluorescence intensity (F/F0) of plasma membranes of cells with increasing ligand concentration. HEK293T cells transfected with GABAAR(α1/β3/γ2) were treated with 100 nM Gzn-OG, and then the fluorescence intensity of cells was measured by confocal microscopy with increasing GABA or gabazine concentration. The Kd values of GABA and gabazine for GABAAR(α1/β3/γ2) were determined to be 16.9 μM and 214 nM, respectively, by fitting the fluorescence change with a logistic equation. For details, see Methods. n = 12. Data represent mean ± SEM.

