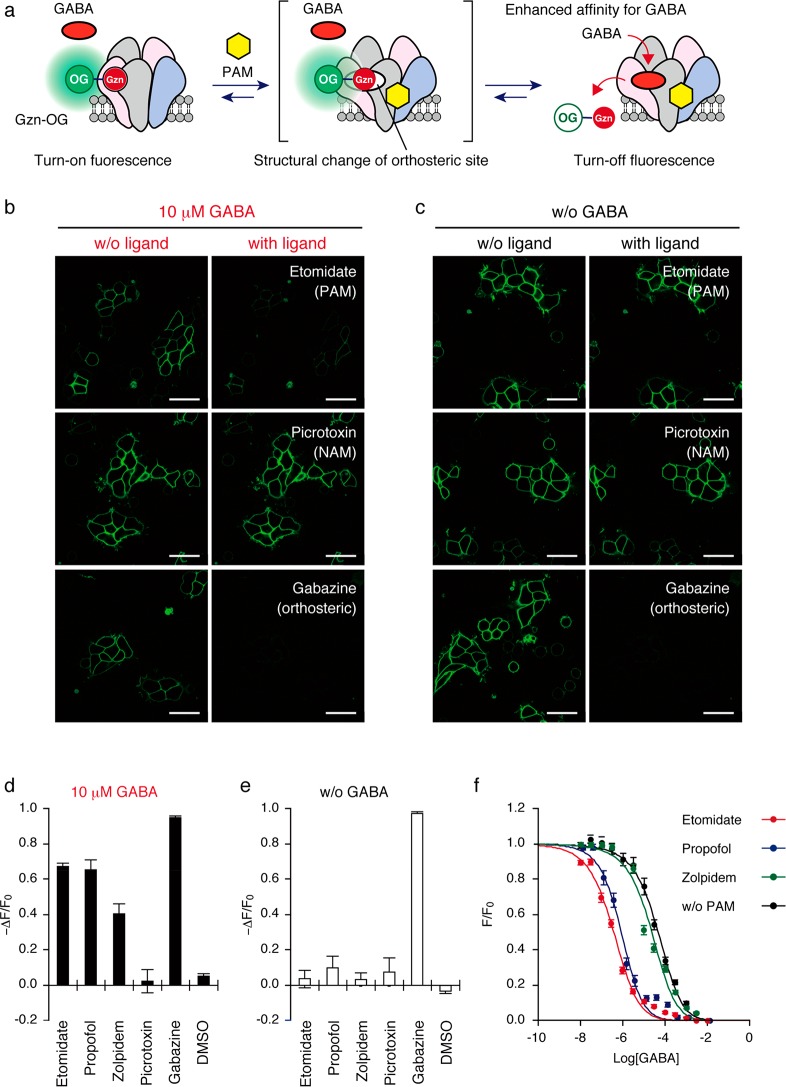
Figure 3.
Detection of PAMs for GABAAR(α1/β3/γ2) using Gzn-OG. (a) Schematic illustration of the assay system for detecting PAMs. (b, c) Ligand induced CLSM imaging change in the presence (b) or absence (c) of GABA. The cells were treated with 100 nM Gzn-OG, and then ligand (200 μM etomidate (PAM), 20 μM picrotoxin (NAM) or 100 μM gabazine (orthosteric antagonist)) was added in the presence (b) or absence (c) of 10 μM GABA. Scale bar = 40 μm. (d and e) Fluorescence changes after adding various types of GABAAR ligands in the presence (d) or absence (e) of GABA (10 μM). The fluorescent intensity change (−ΔF/F0) after addition of each ligand is shown. Each ligand concentration is as follows: etomidate (200 μM), propofol (200 μM), zolpidem (20 μM), picrotoxin (20 μM), and gabazine (100 μM). Data represent mean ± SEM n = 10–12. (f) Plots of fluorescence intensity (F/F0) of plasma membranes of cells with increasing GABA concentration. HEK293T cells transfected with GABAAR(α1/β3/γ2) were treated with 100 nM Gzn-OG and each PAM, and then the fluorescence intensity of cells was measured by confocal microscopy with increasing GABA concentration. The EC50 and Kd values of GABA in the presence of each PAM were determined by fitting the fluorescence change with a logistic equation. For details, see Methods. n = 12. Data represent mean ± SEM Kd values for GABA were determined to be 0.13, 0.23, 8.1, and 16.9 μM in the presence of PAM (etomidate, propofol, or zolpidem), or absence of PAM, respectively.

