Figure 1.
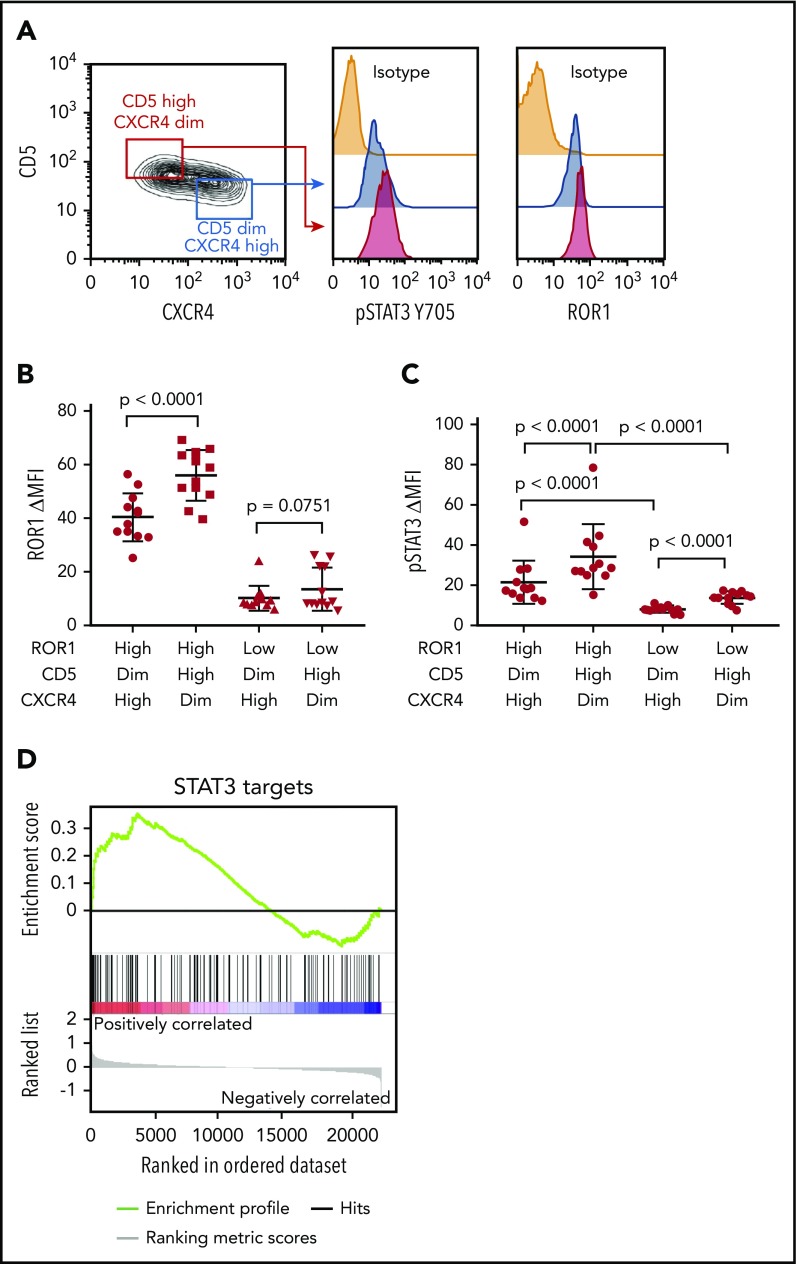
CD5high CXCR4dim CLL cells express higher levels of ROR1 and phosphorylated STAT3 than CD5dim CXCR4high counterparts. (A) Flow cytometry analysis of pSTAT3 (Y705) and ROR1 in CD5high CXCR4dim and CD5dim CXCR4high CLL cells. (B) Dot figures representing ROR1 intensity in CD5high CXCR4dim and CD5dim CXCR4high CLL cells from ROR1high (n = 12) and ROR1low (n = 12) patients. Error bars denote standard deviation. (C) Bar figures representing pSTAT3 ΔMFI in CD5high CXCR4dim and CD5dim CXCR4high CLL cells from ROR1high (n = 12) and ROR1low (n = 12) patients. Error bars denote standard deviation. (D) GSEA plot of STAT3 target genes in lymph nodes vs peripheral blood CLL cells collected from 17 patients. The gene set size was 97, the normalized enrichment score (NES) was 1.30, and the false discoveray rate (FDR) q value was 0.08.

