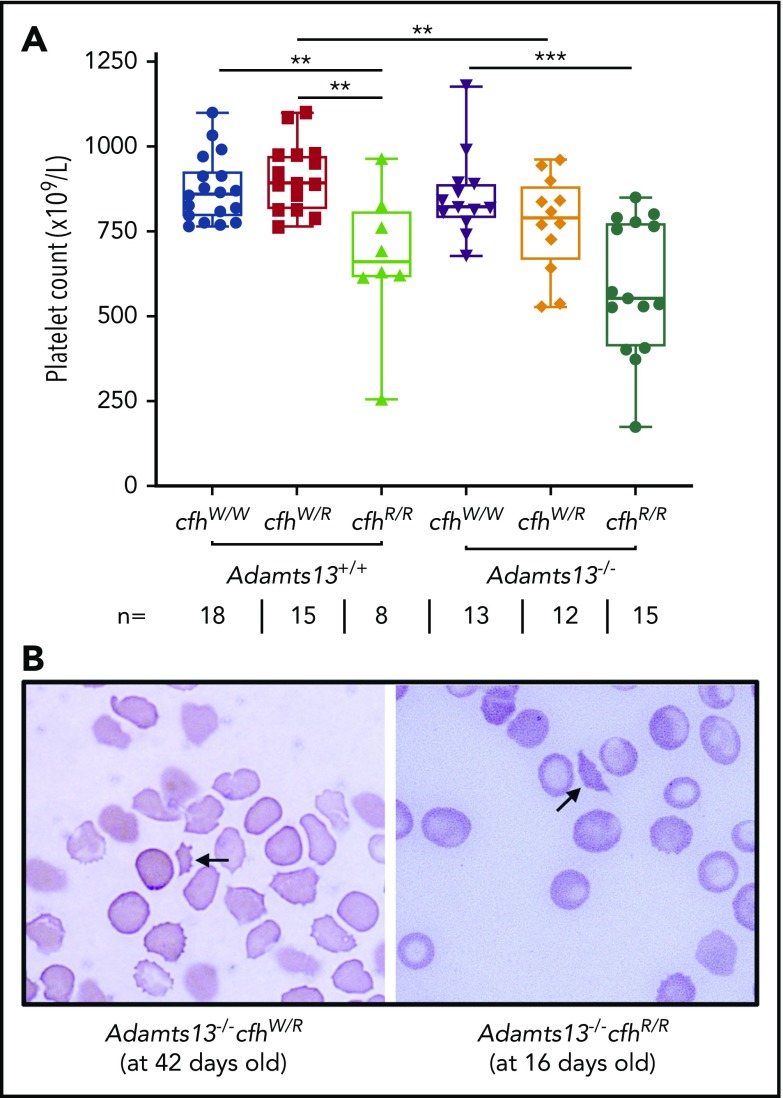
Figure 1.
Platelet counts and schistocytes in theperipheral blood smear from mice with various genotypes. (A) Platelet counts in mice with various genotypes are shown as the dots in the box-whisker plots. Each dot represents the platelet count of an individual mouse. The box spans the interquartile range. The top and bottom lines outside of the box represent the maximal and minimal values, respectively. The Mann-Whitney U test was performed to compare the difference of platelet counts in wt or Adamts13−/− with each of the other experimental groups. **P < .01 and ***P < .005, respectively. The number (n =) of mice with each genotype is shown below the graph. (B) Blood smear reveals the red blood cell morphology. The arrow indicates the fragmentated red blood cells (or schistocytes) in the background of other red blood cells from Adamts13−/−cfhW/R at the age of 42 days and Adamts13−/−cfhR/R at the age of 16 days. Wright-Giemsa stain; original magnification ×200.

