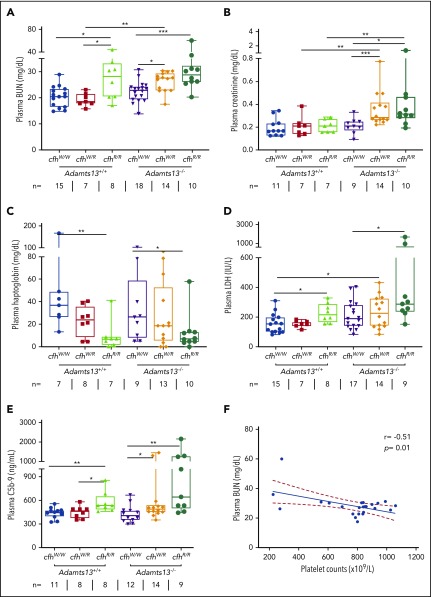
Figure 2.
Plasma BUN, creatinine, haptoglobin, and LDH in mice with various genotypes. Box-whisker and dot plots show the median, interquartile, minimum to maximum, and each individual value of plasma BUN (A), creatinine (B), haptoglobin (C), and LDH (D), as well as sC5b-9 (E) in mice at the age of 2 to 3 months with various genotypes. The Mann-Whitney U test was performed to compare the difference in each biomarker between the wt or Adamts13−/− and each of the other experimental groups. (E) A negative correlation was detected between BUN and sC5b-9 in plasma of Adamts13−/−cfhW/R and Adamts13−/−cfhR/R mice. *P < .05, **P < .01, and ***P < .001, respectively. The number of mice (n =) from each genotype tested is shown under each graph. (F) Pearson correlation coefficient (r = −0.51, P = .01) between platelet counts and plasma BUN levels was determined using Prism 7 software.

